Download
1 / 46
460 likes | 591 Views
Earth’s Energy Imbalance Kevin E Trenberth NCAR. Energy on Earth The main external influence on planet Earth is from radiation. Incoming solar shortwave radiation is unevenly distributed owing to the geometry of the Earth-sun system, and the rotation of the Earth.

E N D
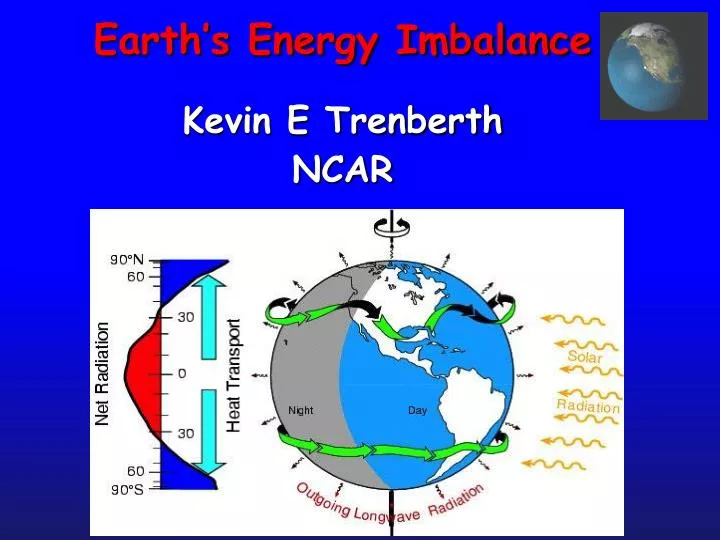
Earth’s Energy Imbalance Kevin E Trenberth NCAR
Energy on Earth The main external influence on planet Earth is from radiation. Incoming solar shortwave radiation is unevenly distributed owing to the geometry of the Earth-sun system, and the rotation of the Earth. Outgoing longwave radiation is more uniform.
Global warming: Under no climate change, the net flow of energy in from the sun is balanced by the net radiation out to space. ASR=OLR With global warming there is a net energy imbalance as heat trapping gases lower OLR: Net = ASR -OLR
Global temperature and carbon dioxide: anomalies through 2012 Base period 1900-99; data from NOAA
A few cooler years do not mean global warming is not happening! 2010 2005 1998 2003 2002 2006 2009 2007 2004 2012 2004 2001 2011 13 1998 was especially warm from the major El Nino, but by cherry picking points one can infer the wrong trend (red) vs the correct one (black dashed). Has it happened before? NOAA/NCDC data Thru 2012
Earth’s Energy Imbalance:How do we measure it? • Direct measurements from space of ASR, OLR, Net • Take inventory of where all the energy has gone • Use climate models with specified forcings • Use atmospheric reanalyses Not accurate enough, but good for relative changes Best, but is there some energy missing? Likely not consistent over time. Depends on how good the model and the forcings are. Useless, do not conserve energy, do not have accurate forcings
Global warming means more heat:Where does the heat go? >90% • Warms land and atmosphere • Heat storage in the ocean (raises sea level) • Melts land ice (raises sea level) • Melts sea ice and warms melted water • Evaporates moisture rain storms, cloud possibly reflection to space
TOA energy imbalance from CCSM4 • Specified radiative forcings from • increased GHGs, • solar, • volcanoes, • aerosols
Rel to ens. mean Mo s.d. 0.62 12-mo s.d. 0.25 W m-2 0.9 W m-2
El Chichón aerosol Prescribed profile in CCSM4
Recent volcanic eruptions: Optical depth of aerosols Adapted from Santer et al 2013
Radiative forcing (W m-2) from changes in Total Solar Irradiance from the Total Irradiance Monitor (TIM) instrument relative to a base value of TSI of 1361.14 W m-2 as 27-day running averages. The arrow at right shows the range of 0.15 W m-2.
Ocean Heat Content Balmaseda, Trenberth and Källén 2013 GRL
Ocean Obs CatiaDomingues
ArgoTemperature Obsper 1 deg square State of the Climate 2012
ECMWF Ocean Reanalysis v4: ORAS4 Balmaseda et al. Quart J R Met Soc 2013 5 member ensemble; perturbed initial states 52-year reconstruction for 1958 through 2009 NEMO ocean model 1° 42 level 3Dvar Bias corrected using Argo era Sfc fluxes from ERA, relaxed to obs SST (2-3 days) Corrected XBTs, altimetry 10 day cycle
Global Ocean Heat Content Amount of heat Balmaseda, Trenberth and Källén 2013
OHC from ORAS4 and rates of change 12-mo running means Diff: 0.21 W m-2 2000s
Rates of change of OHC from ORAS4 Full depth 5 member ensemble members of ORAS4 OHC in global W m-2. The ensemble mean and monthly standard deviation of CCSM4 TOA radiation RT. El Niño events are marked by the orange bars, as defined by the ONI index of NOAA.
ENSO in ORAS4 TOGA-TAO/Triton array was mainly established 1992-93 These are normalized to be global W m-2. The tropical Pacific Ocean first then the global ocean loses heat over an El Nino event
ENSO and volcanic events conflated El Niño events occurred July 1963-January 1964 vsAgungFeb-Mar 1963; May 1982-June 1983 vs El Chichon Mar-Apr 1982; and May 1991-July 1992 vs Pinatubo June 1991.
Decadal variability Given the stronger and more frequent La Niña events since 1998 – related to the Pacific Decadal Oscillation (PDO) – a major question is what role these variations are playing?
Decadal variability: PDO EOF= Empirical Orthogonal Function = Principal Component Analysis = Eigenvector of covariance matrix Based on SST EOF analysis north of 20N in Pacific with global mean removed. Courtesy Adam Phillips
-ve -ve +ve +ve +ve
OHC0-100m0-700mFull depth Note different color scales
SLP and surface windsERA-I Polar perspective NH
Sea level trend:global mean (3 mm/yr) removed Gary Lagerloef 2013
Linear OHC trends: ocean W m-2 0.91 W m-2 when melting ice etc included.
NOAA UKMO
CERES vs ORAS4 12 month running means CERES, ORAS4 Argo=Roemmich and Gilson WOA = Levitus et al. vSch = von Schuckmann
OHC vs CERES • There is not great agreement between OHC changes and CERES • ORAS4 fluctuations are supported by other OHC analyses • At times there are marked significant discrepancies, notably: • 2002 (CERES low vs OHC) • 2007 (CERES high vs OHC) • 2009 (CERES high vs OHC) • While the error bars are large, • there appears to be either: • missing energy, or • mismatches in CERES vs OHC
Key signals in ORAS4 • During the last decade, the ocean has warmed at a higher rate than in the preceding record, even when the impact of Argo is taken into account. • About 30% of the warming occurs in depths below 700m. This involvement of the deep ocean in the heat uptake is unprecedented. • Volcanic eruptions, ENSO and the deep ocean contribute identifiable signals to the character of ocean heat content changes. • The increasing disparity of warming in different layers arises largely from changes in the surface winds, and remains even when the Argo is withdrawn.
Missing energy in CCSM4? In CCSM4, sfc T rises in 5 ensemble members. Meehl et al 2011
Missing energy in CCSM4? In CCSM4, during periods with no sfc T rise, the energy imbalance at TOA remains about 1 W m-2 warming. So where does the heat go? Meehl et al 2011
750 to 3000m Is the same as for 750 to bottom. Meehl et al 2011
Missing energy in CCSM4? Taking five ensemble members of RCP4.5 and compositing 10 distinct 10-year periods with either zero or slightly negative globally averaged temperature trend shows these time periods are characterized by a negative phase of the Interdecadal Pacific Oscillation (IPO) or La Niña. Meehl et al 2011
Earth’s energy imbalance Varies from day to day with clouds and weather Varies from year to year with ENSO And with sharp drops with volcanic eruptions Varies with the PDO The net imbalance of energy in the 2000s went from order 1 W m-2 to 0.7 W m-2with the quiet sun and minor volcanic activity
Missing energy? Some missing energy appears to be in the deep ocean and unprecedented heating of the deeper ocean is occurring. It is related to La Niña/ negative PDO During the positive phase of PDO, more heat is deposited at shallow depths, while in –ve PDO more heat is deposited below 700 m depth.
Deep Doo Doo Lynne Page http://limericksbylin.com/ There's a clearer analysis formingOf the increase in powerful storming;But it's not just hot airAbout which we should care,For the cold ocean depths have been warming.