Download
1 / 5
50 likes | 131 Views
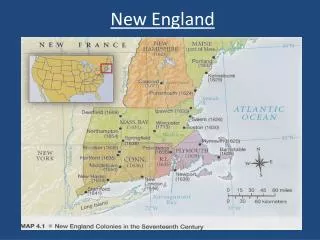
This study by NOAA and Boston College examines flood trends in New England over approximately 75 years through 2006. Data from USGS HCDN stream gauge records are used to analyze annual floods and peak of water year variables. Ongoing investigations in the U.S., Mid-Atlantic, and Atlantic Canada aim to understand flood patterns in the region. Results indicate increasing flood magnitudes in 25 out of 28 gauges, with 10 showing significant trends. Similarly, 22 of 23 gauges show a rise in annual flood counts, with 10 exhibiting statistically significant trends.

E N D
New England Flood Trends Matt Collins and William Armstrong (NOAA); Noah Snyder (Boston College) Data sources: USGS HCDN stream gauge records Timeframe: records average ~75 yrs through 2006 Variables: Annual floods—largest inst. peak of WY Variables: POT/WY—# peaks over threshold per WY Location: 28 (23) New England watersheds Ongoing investigations in U.S. Mid-Atlantic and Atlantic Canada
Annual Series Results • 25 of 28 gauges show ↑ magnitude trends • 10 (40%) have p<0.1
POT/WY Results • 22 of 23 gauges show ↑ annual flood counts • 10 (45%) have p<0.1