Download
1 / 4
40 likes | 168 Views
ZoomCharts is offering data visualization tools to support speakers at the 29th New England Statistics Symposium, taking place April 24th to 25th, 2015 at the University of Connecticut in Storrs, Connecticut 06269. Check out what you can do with ZoomCharts charts and graphs at http://zoomcharts.com The world’s most interactive data visualization software, ZoomCharts lets you create completely interactive visual representations of big data sets on all modern devices at remarkably fast speeds. ZoomCharts tools are being discovered by a growing number of clients in a variety of fields as the best way to analyze and present data. Don’t be among the last to discover the exciting potential that ZoomCharts tools can open up for your data. The New England Statistics Symposium is hosted by the Department of Statistics at the University of Connecticut. It aims to connect New England statisticians so that they can network with colleagues and share research in emerging issues. Keynote speakers include Yaakov Bar-Shalom of the University of Connecticut and Adrian Raftery of the University of Washington. The symposium features three full day short courses taking place on April 24th: "Bayesian Biostatistics: Design of Clinical Trials and Subgroup Analysis" by Peter Müller, "Modern Multivariate Statistical Learning: Methods and Applications" by Kun Chen and Jun Yan, and "Boosting R Skills and Automating Statistical Reports" by Yihui Xie. ZoomCharts http://www.zoomcharts.com The world’s most interactive data visualization software

E N D
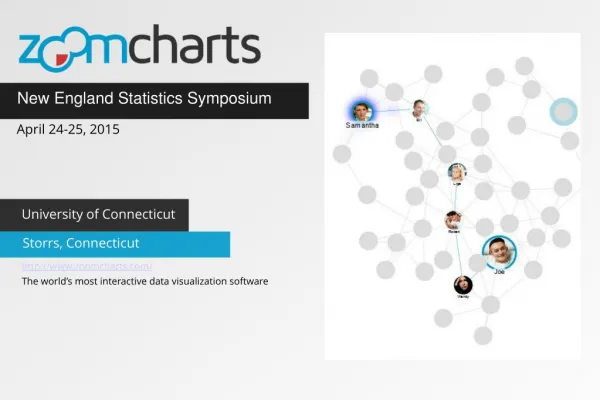
New England Statistics Symposium April 24-25, 2015 University of Connecticut Storrs, Connecticut http://www.zoomcharts.com/ The world’s most interactive data visualization software
ZoomCharts for New England Statistics Symposium April 24-25, 2015 ZoomCharts is offering data visualization tools to support speakers at the 29th New England Statistics Symposium, taking place April 24th to 25th, 2015 at the University of Connecticut in Storrs, Connecticut 06269. Check out what you can do with ZoomCharts charts and graphs at http://zoomcharts.com The world’s most interactive data visualization software, ZoomCharts lets you create completely interactive visual representations of big data sets on all modern devices at remarkably fast speeds. ZoomCharts tools are being discovered by a growing number of clients in a variety of fields as the best way to analyze and present data. Don’t be among the last to discover the exciting potential that ZoomCharts tools can open up for your data. The New England Statistics Symposium is hosted by the Department of Statistics at the University of Connecticut. It aims to connect New England statisticians so that they can network with colleagues and share research in emerging issues. Keynote speakers include Yaakov Bar-Shalom of the University of Connecticut and Adrian Raftery of the University of Washington. The symposium features three full day short courses taking place on April 24th: "Bayesian Biostatistics: Design of Clinical Trials and Subgroup Analysis" by Peter Müller, "Modern Multivariate Statistical Learning: Methods and Applications" by Kun Chen and Jun Yan, and "Boosting R Skills and Automating Statistical Reports" by Yihui Xie.
ZoomCharts for New England Statistics Symposium April 24-25, 2015
Check out ZoomCharts products: Network Chart Big network exploration Explore linked data sets. Highlight relevant data with dynamic filters and visual styles. Incremental data loading. Exploration with focus nodes. Time Chart Time navigation and exploration tool Browse activity logs, select time ranges. Multiple data series and value axes. Switch between time units. Pie Chart Amazingly intuitive hierarchical data exploration Get quick overview of your data and drill down when necessary. All in a single easy to use chart. Facet Chart Scrollable bar chart with drill-down Compare values side by side and provide easy access to the long tail. ZoomCharts http://www.zoomcharts.com/ The world’s most interactive data visualization software