Download
1 / 30
300 likes | 394 Views
Study on synoptic differences in significant snowfall events in Central New England, focusing on Plymouth, NH, compared to surrounding cities. Data analyzed from 1996-2007 for meteorological patterns influencing snowfall. Results show synoptic changes affecting snowfall variability.

E N D
Synoptic Analysis of Heavy Snowfalls over Central New England, 1996-2007 Daniel Michaud Jared Rennie Norman Shippee
Introduction and Objectives • Forecasting Snowfall can be a tricky task • Synoptic changes and topographic features can enhance precipitation, as well as inhibit it. • This research concerns itself with the synoptic differences between: • Cases where Plymouth, NH receives significant snowfall • Cases where little or no snowfall was recorded in Plymouth, yet surrounding cities received significant accumulations
Data and Methodology • F6 Climatological Data • Winter seasons of 1996 through 2007 • Looked at three cities: • Plymouth, NH • Concord, NH • St. Johnsbury, VT • Defined an “event” as when any one of the above three cities received significant snowfall during a single storm • Determining “Significant Snowfall” • Local NWS definition of a winter storm warning • Area receiving at least seven inches from a single storm (NOAA 2005)
Data and Methodology (con’t) • Surface Maps • Determined to classify storm evolution • Lee side cyclogenesis off the Rocky Mountains • Coastal Redevelopment (most cases were this) • Multiple cases were eliminated • Data was split into two groups • Criteria (Plymouth receiving 7”) • 25 cases • Non-Criteria (Plymouth not receiving 7”) • 19 cases
Data and Methodology (con’t) • Using local Metars and archived surface maps • Time of snowfall initialization was calculated and inserted into NCEP/NCAR composites • 12 hourly composites were created for the following three cases • All 44 cases (used as a control) • 25 Criteria Cases • 19 Non-Criteria Cases • Generated maps of 250-hPa winds, 500-hPa heights, 700-hPa omega, 850-hPa vector winds/temperatures, sea level pressure and surface winds
Fig. 1. NCEP/NCAR Composite analysis 24 hours prior to event onset (T-24) for a) 250-hPa vector wind, b) 500-hPa geopotential height, c) 850-hPa temperature, and d) sea-level pressure. a. b. c. d. 0°C Fig. 1. NCEP/NCAR Composite analysis 24 hours prior to event onset (T-24) for a) 250-hPa vector wind, b) 500-hPa geopotential height, c) 850-hPa temperature, and d) sea-level pressure.
a. b. c. d. 0°C Fig. 2. NCEP/NCAR Composite analysis 12 hours prior to event onset (T-12) for a) 250-hPa vector wind, b) 500-hPa geopotential height, c) 850-hPa temperature, and d) sea-level pressure.
a. b. c. d. 0°C Fig. 3. NCEP/NCAR Composite analysis at event onset (T-0) for a) 250-hPa vector wind, b) 500-hPa geopotential height, c) 850-hPa temperature, and d) sea-level pressure.
a. b. c. d. 0°C Fig. 4. NCEP/NCAR Composite analysis 12 hours after event onset (T+12) for a) 250-hPa vector wind, b) 500-hPa geopotential height, c) 850-hPa temperature, and d) sea-level pressure.
a. b. c. d. 0°C Fig. 5. NCEP/NCAR Composite analysis 24 hours after event onset (T+24) for a) 250-hPa vector wind, b) 500-hPa geopotential height, c) 850-hPa temperature, and d) sea-level pressure.
a. b. c. d. Fig. 6. NCEP/NCAR Composite analysis of criteria events for Plymouth, NH 24 hours prior to event onset (T-24) for a) 250-hPa vector wind, b) 500-hPa geopotential height, c) 850-hPa temperature, and d) sea-level pressure.
a. b. c. d. Fig. 7. NCEP/NCAR Composite analysis of non-criteria events for Plymouth, NH 24 hours prior to event onset (T-24) for a) 250-hPa vector wind, b) 500-hPa geopotential height, c) 850-hPa temperature, and d) sea-level pressure.
a. b. c. d. Fig. 8. NCEP/NCAR Composite analysis of criteria events for Plymouth, NH 12 hours prior to event onset (T-12) for a) 250-hPa vector wind, b) 500-hPa geopotential height, c) 850-hPa temperature, and d) sea-level pressure.
a. b. c. d. Fig. 9. NCEP/NCAR Composite analysis of non-criteria events for Plymouth, NH 12 hours prior to event onset (T-12) for a) 250-hPa vector wind, b) 500-hPa geopotential height, c) 850-hPa temperature, and d) sea-level pressure.
a. b. c. d. Fig. 10. NCEP/NCAR Composite analysis of criteria events for Plymouth, NH at event onset (T-0) for a) 250-hPa vector wind, b) 500-hPa geopotential height, c) 850-hPa temperature, and d) sea-level pressure.
a. b. c. d. Fig. 11. NCEP/NCAR Composite analysis of non-criteria events for Plymouth, NH at event onset (T-0) for a) 250-hPa vector wind, b) 500-hPa geopotential height, c) 850-hPa temperature, and d) sea-level pressure.
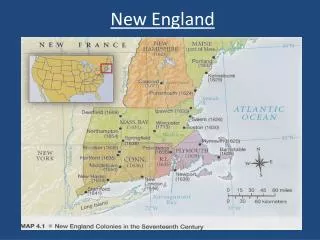
Fig. 12. Topographical Map of New Hampshire. Arrows depict surface wind direction. (Image courtesy Color Landform Atlas of the United States) Non-Criteria Criteria
a. b. c. d. Fig. 13. NCEP/NCAR Composite analysis of criteria events for Plymouth, NH 12 hours after event onset (T+12) for a) 250-hPa vector wind, b) 500-hPa geopotential height, c) 850-hPa temperature, and d) sea-level pressure.
a. b. c. d. Fig. 14. NCEP/NCAR Composite analysis of non-criteria events for Plymouth, NH 12 hours after event onset (T+12) for a) 250-hPa vector wind, b) 500-hPa geopotential height, c) 850-hPa temperature, and d) sea-level pressure.
a. b. c. d. Fig. 15. NCEP/NCAR Composite analysis of events for Plymouth, NH 12 hours after event onset (T+12) for a) criteria surface temperature, b) non-criteria surface temperature, c) criteria surface vector wind, and d) non-criteria surface vector wind.
a. b. c. d. Fig. 16. NCEP/NCAR Composite analysis of criteria events for Plymouth, NH 24 hours after event onset (T+24) for a) 250-hPa vector wind, b) 500-hPa geopotential height, c) 850-hPa temperature, and d) sea-level pressure.
a. b. c. d. Fig. 17. NCEP/NCAR Composite analysis of non-criteria events for Plymouth, NH 24 hours after event onset (T+24) for a) 250-hPa vector wind, b) 500-hPa geopotential height, c) 850-hPa temperature, and d) sea-level pressure.
a. b. c. d. Fig. 18. NCEP/NCAR Composite analysis of events for Plymouth, NH 24 hours after event onset (T+24) for a) criteria surface temperature, b) non-criteria surface temperature, c) criteria surface vector wind, and d) non-criteria surface vector wind.
Fig. 19. Topographical Map of New Hampshire. (Image courtesy Color Landform Atlas of the United States)
Conclusions • There are several crucial differences in storm evolution within the 24 hours surrounding event onset • Cases meeting criteria in Plymouth are generally colder at low levels • The cyclone in these cases develops slower, deepens rapidly around T+12, takes a track further offshore • Non-criteria cases develop faster due to better mid- and upper-level dynamics, create more WAA downstream over New England • Low level flow and topographical influences can make or break a large snowfall event in Plymouth • Cases meeting criteria in Plymouth tend to have a period of easterly surface winds at event onset whereas non-criteria cases tend to have northeasterly flow (terrain blocking) • Non-criteria cases tend to have stronger cold advection soon after (T+24) event onset on a west-northwesterly flow (a dry, downsloping direction) • Criteria cases have north to northeasterly flow at this time period, allowing for continued access to Atlantic moisture and the possibility of wrap-around precipitation to continue across the area
Works Cited • HPC, cited 2007: Surface Analysis Archive. [available online at http://www.hpc.ncep.noaa.gov/html/sfc_archive.shtml] • Kocin, Paul J and Uccellini, Louis W, 2004: Northeast Snowstorm: Volume I: Overview, Volume II: The Cases. Meteorological Monograph Series, 818 pp. • NCDC, cited 2007: Unedited Local Climatological Data. [available online at http://cdo.ncdc.noaa.gov/ulcd/ULCD] • NCEP/NCAR, cited 2006: 6-Hourly Reanalysis Data Composites. [available online at http://www.cdc.noaa.gov/Composites/Hour/] • NWS Gray, Maine Climate Data, cited 2007: Monthly F6 Climate Statistics.[available online at http://www.erh.noaa.gov/er/gyx/climate_f6.shtml] • PSU Vortex, cited 2007: Product Generator for Archive Data. [available online at http://vortex.plymouth.edu] • Unisys Weather, cited 2007: Image and Map Archive. [available online at http://weather.unisys.com/archive/index.html]