Circle Graphs
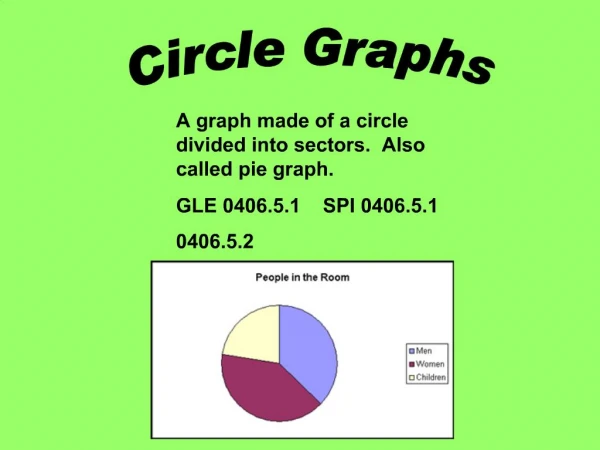
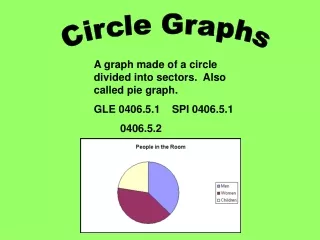
Circle Graphs. A circle graph shows how the parts of something relate to the whole. A circle graph is divided into sectors, where each sector represents a particular category. The entire circle is 1 whole or 100%, and a sector of the circle is a part. . Creating A Circle Graph.

Circle Graphs
E N D
Presentation Transcript
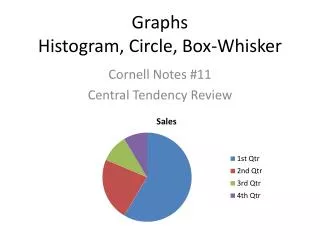
Circle Graphs A circle graph shows how the parts of something relate to the whole. A circle graph is divided into sectors, where each sector represents a particular category. The entire circle is 1 whole or 100%, and a sector of the circle is a part.
Creating A Circle Graph A circle graph shows how the parts of something relate to the Whole. A circle graph is divided into sectors, where each sector represents a particular category. The entire circle is 1 whole or 100%, and a sector of the circle is a part. To create a circle graph, follow these steps: 1. Write each number as a percent of the total. 2. Find the size of each angle for the circle graph. 3. Draw a circle. 4. Draw the angles with a protractor. 5. Label each sector with a percent. 6. Give the graph a title.
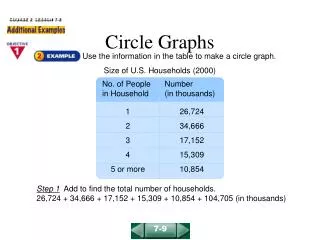
e.g. A survey was conducted of 140 people to find out what their favourite sport was. The results are displayed in the table below. Construct a circle graph to display the data. Step 1: Convert each number to a percent. Soccer 35 X 100% = 25% 140 Baseball 49 X 100% = 35% 140 Hockey 21 X 100% = 15% 140 Swimming 35 X 100% = 25% 140
Step 2: Find the size of each angle for the circle graph. Soccer 25% of 360 = 0.25 X 360 = 90 Baseball 35% of 360 = 0.35 X 360 = 126 Hockey 15% of 360 = 0.15 X 360 = 54 Swimming 25 % of 360 = 0.25 X 360 = 90 Total = 360 Next:Follow Steps 3 to 6 as mentioned above.
Your circle graph should have a title that is underlined. Each sector should be labelled and have a percent on it as well.