10-2 Circle Graphs
50 likes | 219 Views
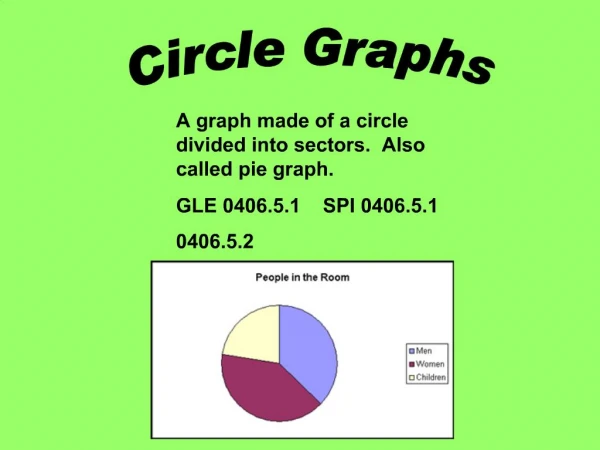
10-2 Circle Graphs. D1: Read and interpret graphs. Circle Graphs:. Show parts to a whole All circle graphs represent 100% Good for showing survey results. 100%. 50%. 33.3%. 33.3%. 25%. 25%. 33.3%. Steps to create a circle graph. Find the percent that each part represents

10-2 Circle Graphs
E N D
Presentation Transcript
10-2 Circle Graphs D1: Read and interpret graphs
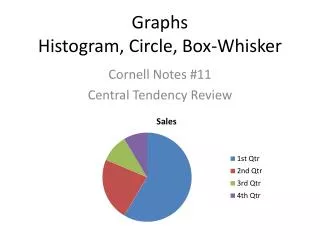
Circle Graphs: • Show parts to a whole • All circle graphs represent 100% • Good for showing survey results 100% 50% 33.3% 33.3% 25% 25% 33.3%
Steps to create a circle graph • Find the percent that each part represents (if not given) • Convert the percentage to degrees of the circle Example: 18% of 360 = 0.18 •360 ≈ 65° • Draw a radius from the center to the side of circle • Measure the given degree by lining up protractor with that radius • Repeat with remaining sectors • Label the sections with the percents & category and give the graph a title
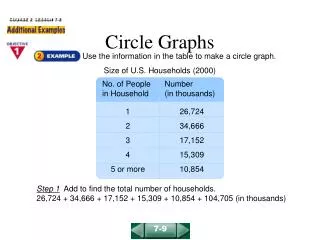
Example: US (1896-2000) Olympic Medals 2,117 100% 360° Add two Columns to table and label % and angle Use steps to create the circle graph How many total medals have been won?