Download
1 / 13
130 likes | 300 Views
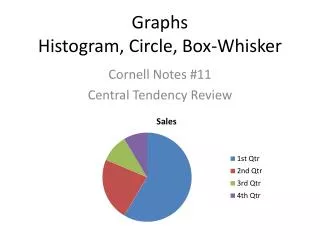
Graphs Histogram, Circle, Box-Whisker. Cornell Notes #11 Central Tendency Review. Choosing the Best Measure. Choosing the Best Measure. Practice:. The following data set shows the number of free throws Jordan had in each of his 12 years playing basketball.

E N D
GraphsHistogram, Circle, Box-Whisker Cornell Notes #11 Central Tendency Review
Practice: The following data set shows the number of free throws Jordan had in each of his 12 years playing basketball. 67, 26, 20, 93, 78, 88, 79, 99, 64, 75, 74, 10 Is the mean, median, or mode best to use to describe this data set? Explain. Data Set: 10, 20, 26, 64, 67, 74, 75, 78, 79, 88, 93, 99 Mean: 64 Median: 74.5 Mode: none Mean: not a good choice- outlier of 10 Mode: none Median: best choice
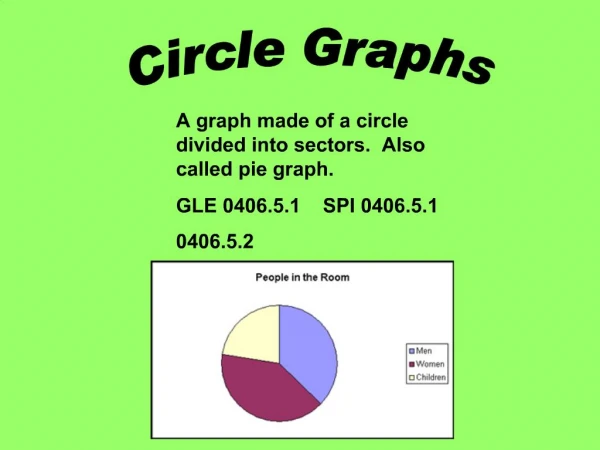
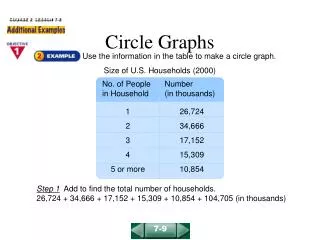
Representations of Data In this lesson, you will take notes on how to construct and interpret histograms and circle graphs. You will also learn how to choose the best graph to represent different types of data.
Histogram Example: Score between 0 and 10 occurred 1 time, 11-20 occurred 2 times (range of scores)