Circle Graphs (Pie Charts)
Circle Graphs (Pie Charts). Colleen Keefe MAT 202 (01) Dr. Marinas. What is a circle graph?. Circle graphs consists of a circular region portioned into disjoint sections, with each section representing a part or percentage of a circle graph. . How to find out percents.


Circle Graphs (Pie Charts)
E N D
Presentation Transcript
Circle Graphs (Pie Charts) Colleen Keefe MAT 202 (01) Dr. Marinas
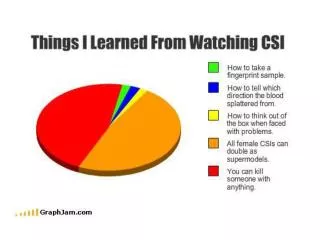
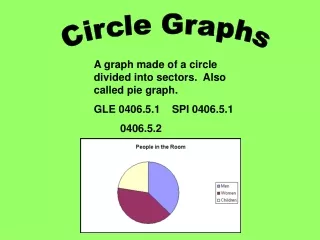
What is a circle graph? • Circle graphs consists of a circular region portioned into disjoint sections, with each section representing a part or percentage of a circle graph.
How to find out percents • When you find out percents in order to use the pie chart you must put the frequency over the total number. ex: If there is a frequency of 64 and there were 100 people surveyed what percent would it be? answer: 64/100 , which is equal to 64%
Using Excel When using excel it is simple all you need to do is enter your data into each cell, then go to input and click on Chart. Use excel to make this into a pie chart
What is your favorite type of juice? In my survey I asked 100 people and these are the results I got back.