Circle Graphs
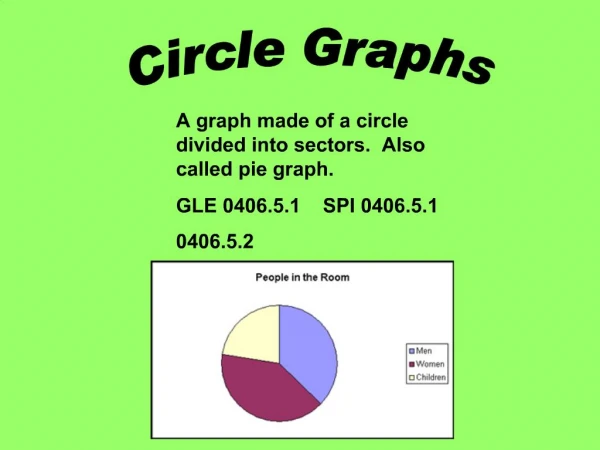
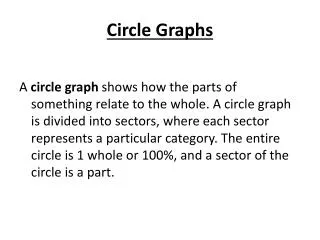
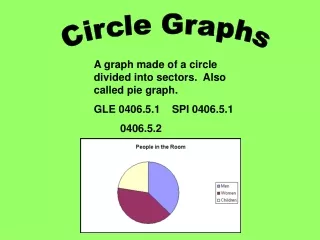
Circle Graphs. Circle Graphs. A graph in the shape of a circle Separates information into categories *Uses percentages (part of a whole). Steps to Take:. First, organize the information. Second, determine the percent for each category.


Circle Graphs
E N D
Presentation Transcript
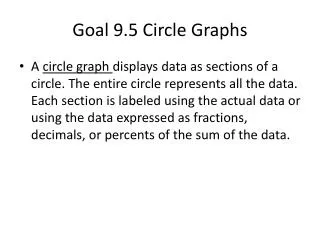
Circle Graphs • A graph in the shape of a circle • Separates information into categories • *Uses percentages (part of a whole)
Steps to Take: • First, organize the information. • Second, determine the percent for each category. • Third, estimate the area of the circle graph to be shaded.
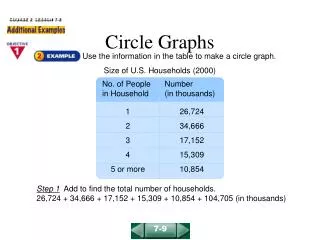
Example: • Together, the basketball team has run 60 miles in the last week. Harrison ran 15 miles, Mike ran 5 miles, Ben ran 30 miles, and Tim ran 10 miles. • Step 1: Player Miles Harrison 15 Mike 5 Ben 30 Tim 10
Example (continued) • Step 2 • Harrison 15 ÷ 60 = 0.25 = 25% • Mike 5 ÷ 60 = 0.08 = 8% • Ben 30 ÷ 60 = 0.5 = 50% • Tim 10 ÷ 60 = 0.17 = 17%
Example (continued) • Step 3
Problems • Make a circle graph with the following data: In 1990, there were 40 animals at the zoo. In 1995, they had 56 animals. In 2000, the number had dropped to 23 due to a hurricane the previous year. In 2005, a new shipment of koalas boosted the number to 43. In 2010, the number of animals was all the way up to 62.
Problems • Mr. Plyler has taught several different class sizes over the past eight years. In 2005, he had 32 students. The next year he had 30. The following year he had 28. When he moved to Humboldt in 2008, he had 25. In 2009, he had 22. In 2010, his class size dropped to 18. However, in 2011, due to a budget cut, his class sizes rose to 23. Then he moved to Medina in 2012 and has a class size of 28. Make a circle graph with this information.