Circle Graphs
Circle Graphs. Interpretation and Design. In the News. Key Terms. Title Categories Percentages Sectors Total numbers. Limitations. Creating Circle Graphs. Required knowledge: how to draw a circle angles in a circle (central angle) calculating percent.

Circle Graphs
E N D
Presentation Transcript
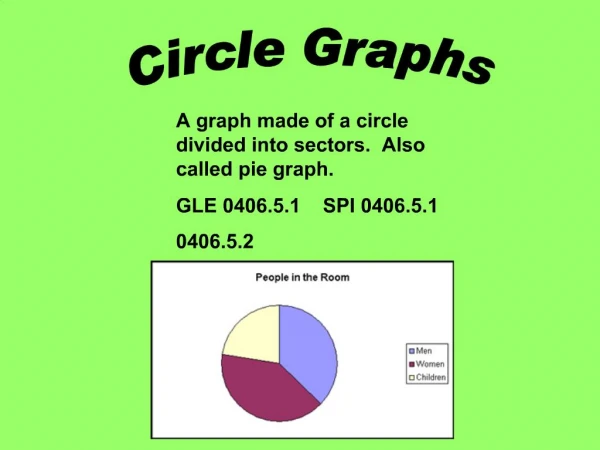
Circle Graphs Interpretation and Design
Key Terms • Title • Categories • Percentages • Sectors • Total numbers
Creating Circle Graphs Required knowledge: • how to draw a circle • angles in a circle (central angle) • calculating percent
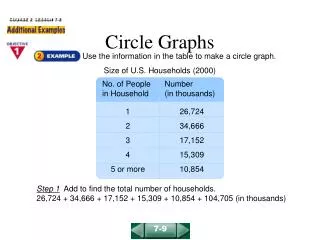
To create a circle graph: - draw a circle- use a protractor to measure and draw each central angle- label each sector with its category and its percent- colour or shade each sector- add a title for the circle graph
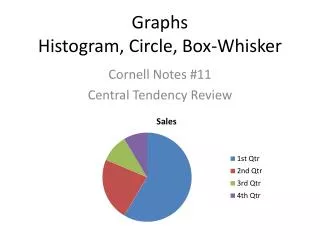
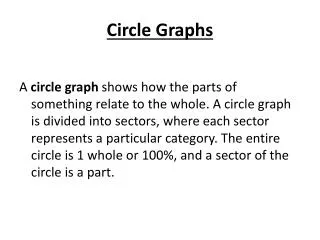
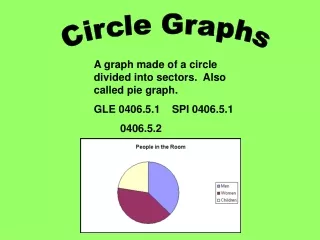
Key Ideas – Interpreting Circle Graphs A circle graph shows how each category of data compares to the whole using percents. The sum of all percents in a circle graph is 100%. Circle graphs are easier to interpret when there are a smaller number of categories and when the percent values are not too close together.
Key Ideas: Creating a Circle Graph The sum of central angles in a circle is 360 degrees. To create a circle graph: • Express each category as a percent of the total. • Use the decimal value of the percent to calculate the measure of the central angle (central angle = decimal value equivalent of percent X 360 degrees). • Use a protractor to measure and draw each central angle. • Add sector labels for the categories and a title to the circle graph.