Download
1 / 4
40 likes | 131 Views
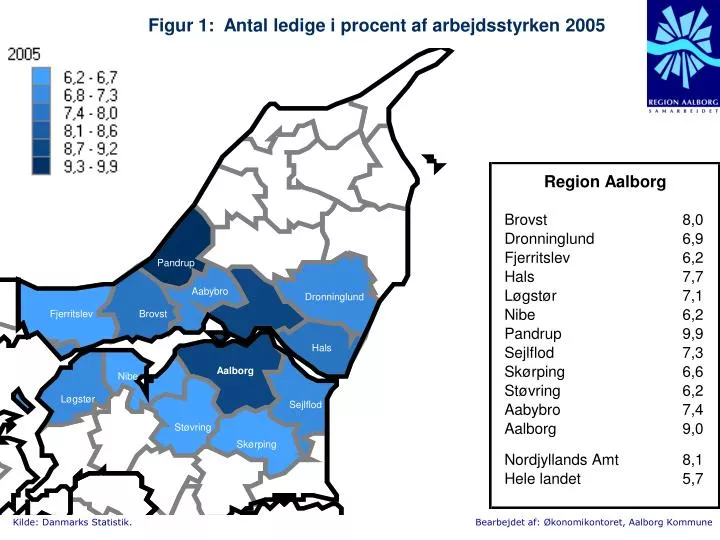
Figur 1: Antal ledige i procent af arbejdsstyrken 2005. Pandrup. Aabybro. Dronninglund. Fjerritslev. Brovst. Hals. Aalborg. Nibe. Løgstør. Sejlflod. Støvring. Skørping. Figur 2: Det gennemsnitlige antal ledige og ledige i procent af arbejdsstyrken i Dronninglund Kommune 2001-2005.

E N D
Figur 1: Antal ledige i procent af arbejdsstyrken 2005 Pandrup Aabybro Dronninglund Fjerritslev Brovst Hals Aalborg Nibe Løgstør Sejlflod Støvring Skørping Bearbejdet af: Økonomikontoret, Aalborg Kommune
Figur 2: Det gennemsnitlige antal ledige og ledige i procent af arbejdsstyrken i Dronninglund Kommune 2001-2005 Bearbejdet af: Økonomikontoret, Aalborg Kommune
Tabel 1: Det gennemsnitlige antal ledige i Dronninglund Kommune Bearbejdet af: Økonomikontoret, Aalborg Kommune
Figur 3: Udviklingen i det gennemsnitlige antal ledige i procent af arbejdsstyrken i Dronninglund Kommune 1996-2005 Bearbejdet af: Økonomikontoret, Aalborg Kommune