Download

1 / 32
320 likes | 2.52k Views
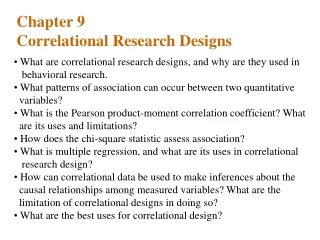
Correlational Research Designs. Correlational studies may be used to A. Show relationships between two variables there by showing a cause and effect relationshipB. show predictions of a future event or outcome from a variable. Types of Correlation studies. 1. Observational Research e.g. class at

E N D
1. Research Designs Correlational By Mike Rippy
2. Correlational Research Designs Correlational studies may be used to
A. Show relationships between two variables there by showing a cause and effect relationship
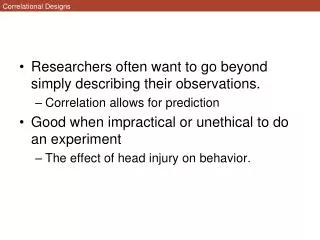
B. show predictions of a future event or outcome from a variable
3. Types of Correlation studies 1. Observational Research e.g. class attendance and grades
2.Survey Research e.g. living together and divorce rate
3. Archival Research e.g.violence and economics
4. Advantages of the correlational method 1. It allows the researcher to analyze the relationship among a large number of variables
2. Correlation coefficients can provide for the degree and direction of relationships
5. Planning a Relationship Study Purpose to identify the cause and effects of important phenomena
Method
1. Define the problem
2. Review existing literature
3. Select participants who can have measurable variables-reasonably homogeneous
4. Collect data-test, questionnaires, interviews, &etc.
5. Analysis of data
6. What do correlations measure? Correlations measure the association, or co-variation of two or more dependent variables.
Example: Why are some students aggressive?
Hypothesis: Aggression is learned from modeling
Test: Look for associations between aggressive behavior and�
7. Interpreting Correlations Scattergram- a pictorial representation of correlations between two variables
Use of a scattergram
An x and y axes are produced perpendicular to each other
Results of correlates are plotted
The relationship of these plots are interpreted
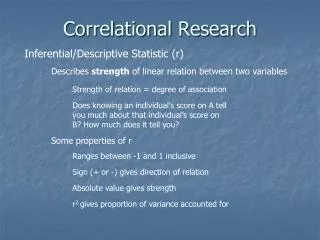
8. Interpreting Correlations continued The amount of correlation is expressed as r=
The r scores can range from �1 to 1
If r= 1 there is said to be perfect correlation with the other variable
An r score of 0 shows no relationship
If r= -1 there is a lack of relationship between the two variables
Anything between 1 and �1 shows a varying degrees of relationships
9. Interpreting Correlations Continued The expression r squared = the percent of variation accounted for between the relations between two variables like x and y this is called the explained variance
Example: correlation between G.P.A. scores and A.C.T. if r=.6 then r squared =.36 so the per cent of accuracy is 36% in predicting A.C.T. scores from the person G.P.A.
A complete interpretation would include attempts to explain nonsignificant results
10. Other measures of interest in Correlational Studies R is multiple correlation (0 to 1)
(b) is regression weight which is a multiplier added to a predictor variable to maximize predictive value
B is beta weight which is used in a multiple regression equation to establish the equation in a standard score form
11. Correlation and Causality If there is no association between two variables, then there is no causal connection
Correlation does not always prove causation a third variable may have the causal relation example: Women surveyed during pregnancy that smoked correlated with arrest of their sons 34 years later. Is a third variable the cause. Other variables- socioeconomic status, age, father�s or mother�s criminal history, Parent�s psychiatric problems
12. Use of causal-comparative approach However, when comparing two variables sometimes inference may be made that one causes the other.
Only an experiment can provide a definitive conclusion of a cause and effect relationship.
13. Limitations of Relationship Studies Researcher tend to break down complex patterns into two simple components.
Researcher identify complex components that interest them but could probably be achieved in many different ways.
14. Ways to fix problems of correlational Design Add more variables to the model
Replicate design
Convert question to the experimental design
15. Prediction Studies A variable whose value is being used to predict is known as the predictor variable
A variable whose value is being predicted is the criterion variable.
The aim of prediction studies is to forecast academic and vocational success.
16. Types of Information provided in a prediction study The extent to which a criterion pattern can be predicted
Data for developing a theory for determining criterion patterns
Evidence about predicting the validity of a test
17. Basic Design of Prediction Studies The problem-reflect the type of information you are trying to predict
Selection of research participants- draw from population most pertinent to your study
Data collection-predictor variables must be measured before criterion patterns occur
Data Analysis- correlate each predictor variable with the criterion
18. Definitions useful in Prediction Studies Bivariate correlational statistics- express the magnitude of relationships between two variables
Multiple regression- uses scores on two or more predictor variables to predict performance of criterion variables. The purpose is to determine which variables can be combined to form the best prediction of each criterion variable.
19. Multiple Regression Facts Too large of a sample may cause faulty data to occur
15 to 54 people should be sampled per variable used.
20. Statistical Factors in Prediction Research Prediction research in useful for practical purposes
Definitions- selection ratio- proportion of the available candidates that must be selected
Base rate- percentage of candidates who would be selected without a selection process
21. Statistical Factors in Prediction Research cont. Taylor-Russell Tables- a combination of three factors; predictive validity, selection ratio, and base rate (If these three factors are present the researcher should be able to predict the proportion of candidates that will be successful)
Shrinkage- The tendency for predictive validity to decrease when research is repeated
22. Techniques used to analyze Bivariates Product-Moment Correlation- Used when both variables are expressed as continuous scores
Correlation Ratio- Used to detect nonlinear relationships
23. Part and Partial Correlation This is an application employed to rule out the influence of one or more variables upon the criterion in order to clarify the role of the other variables.
24. Multivariate correlational Statistics These are used when examining the interrelationship of three or more variables.
25. Correlation Coefficient It measures the magnitude of the relationship between a criterion variable and some combination of predictor variables
Correlation coefficient of determination equals R squared. This expresses the amount of variance that can be explained by a predictor variable of a combination of predictor variables
26. Correlation Coefficient Determinates cont. R can range from 0.00 to 1.00. The larger R is the better the prediction of the criterion variable.
There is more statistical significance if the R squared value is significantly different from zero.
27. Canonical Correlations Is when there is a combination of several predictor variables used to predict a combination of several criterion variables
28. Path Analysis Is a method of measuring the validity of theories about causal relationships between two for more variables that have been studied in a correlational research design
29. Steps of Path Anaylsis Formulate a hypothesis that causally link the variables of interest
Select or develop measures of the variables that are specified by the hypothesis
Compute statistics that show the strength of relationship between each pair of variables that are causally linked in the hypothesis
Interpret to determine if they support the theory
30. Correlation Matrix Is an arrangement of row ad columns that make it easy to see how measured variables in a set correlate with other variables in the set
31. Structural Equation Modeling Is a method of multivariate analysis that test causal relationships between variables and supplies more reliable and valid measures than path analysis
It is also called LISREL which stands for Analysis of Linear Structural Relationships
32. Differential Analysis This is subgroup analysis in relationship studies
This application is used when the researcher believes that correlated variables might be influenced by a particular factor. Then subjects from the sample are selected who have this characteristic
33. Moderator Variables in a prediction Study There are times when a certain test is more valid in predicting a subgroups behavior. The variable that is used in this instance is called a moderator variable