Download
1 / 27
280 likes | 292 Views
Correlational and Causal-Comparative Designs. SPED 8671 Shawnee Wakeman. Review of types of variables. Categorical variables Also called nominal, discrete, dichotomous Ordinal (rank order) variables Continuous variables Subtypes: Interval (no true zero; but equal intervals)

E N D
Correlational and Causal-Comparative Designs SPED 8671 Shawnee Wakeman Adapted from Browder ppt and Creswell 2008
Review of types of variables • Categorical variables • Also called nominal, discrete, dichotomous • Ordinal (rank order) variables • Continuous variables • Subtypes: • Interval (no true zero; but equal intervals) • Ratio (equal intervals and a zero point)
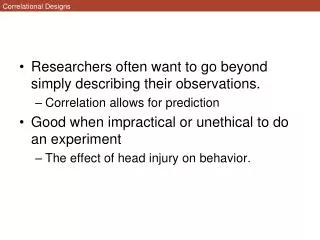
Correlational research designs • Used to describe and measure the degree of association between two or more variables or sets of scores • E.g., IQ and achievement • Student characteristics and EOG scores • Student characteristics and class placement • The “family” of correlational statistics can be applied to different types of measures (continuous, dichotomous, rank)
Explanatory Design The extent to which two variables covary teacher years of training and EOG Absenteeism and math score Procedures Collect data at one point in time Analyze all participants as a single group At least two scores for each participant: one for each variable Use of correlation statistic Prediction Design Identifies one or more predictor variables and a criterion (or outcome) variable Student characteristics that predict placement Teacher characteristics that predict EOG scores Procedures “Prediction” in title Measure predictor variables at one point and outcome variable at another point in time Conclusions predict future occurrence Two Major Types
Characteristics of Correlational Designs • Displays of scores (scatterplots and matrices) • Associations between scores (direction, form, and strength) • Multiple variable analysis (partial correlations and multiple regression)
Depression scores Y=D.V. Hours of Internet use per week Depression (scores from 15–45) 50 - Laura 17 30 40 Chad 41 13 Patricia 18 5 + M 30 Bill 20 9 Rosa 5 25 20 Todd 15 44 + - Angela 7 20 10 Jose 6 30 M Maxine 2 17 5 10 15 20 Hours of Internet Use X=I.V. Jamal 18 48 Mean Score 9.7 29.3 Displays of Scores in a Scatterplot
Displays of Scores in a Correlation Matrix 1 2 3 4 5 6 - • 1.School satisfaction • 2. Extra-curricular activities • 3. Friendship • 4. Self-esteem • 5. Pride in school • 6. Self-awareness - -.33** - .24 -.03 - -.15 .65** .24* - -.09 -.02 .49**.16 - .29** -.02 .39**.03 .22 *p < .05 **p < .01
Associations Between Two Scores • Direction (positive or negative) • Form (linear or nonlinear) • Strength (size of coefficient)
Correlations • Positive correlation • Scores change in same direction • As IQ increases, achievement score increases • As attendance decreases, EOG score decreases • Negative correlation • Scores change in opposite direction • As suspension increases, test scores decrease
Degree of Association • No correlation (r=0) • Perfect positive correlation (r=1.00) • Perfect negative correlation (r=-1.00) • Coefficient of determination • Square the correlation predicts strength of correlation • E.g., If r=.70; 49% of variability in one variable can be explained by another • (correlations .66 and above good per textbook)
B. Negative Linear (r = -.68) A. Positive Linear (r = +.75) • No Correlation • (r = .00) Association Between Two Scores: Linear and Nonlinear Patterns
Statistical Methods of Correlational Designs • Pearson Product Moment Correlation • Spearman rho-non linear order correlation • Point Biserial- correlate continuous interval data with a dichotomous variable • Phi-coefficient: determine the degree of association when both variable measures are dichotomous • Options for multiple predictor or outcome variables
Pearson Product Moment Correlation • Decision One: Type of variables • Both are continuous • Decision Two-Normal distribution: Yes • Decision Three- Number of variables • Two continuous variables • Can also say one predictor and one outcome variable
Pearson Product Moment Correlation • Test statistic r • E.g., r=.05 or r= -.87 • 1.00 perfect positive; -1.00 perfect negative; and 0 is no correlation • Degrees of freedom N-2 • What r asks of the data: Whether a correlation is different from 0.
Spearman-rho“Spearman Rank-Order Correlation” • Decision 1: Type of variables? • When you have two ordinal (rank order) variables NOTE: this is what differs from Pearson Product • Decision 2: Normal distribution? NO • So is it parametric or nonparametric? • Decision 3: • Number of variables: 1 predictor and 1 outcome
Spearman rho • Test statistic Greek letter rho • Degrees of freedom N-2 • Data will be (Greek letter rho=.52) • What it asks of the data- is the correlation different from 0
Phi Statistic • If both variables are dichotomous (other terms- nominal, categorical) • phi coefficient; written with Greek letter phi
What if More Than One Predictor or Outcome? • Multiple predictors for one outcome • E.g., variables that predict graduation • Discriminant function analysis • Use when outcome variable is CATEGORICAL • Multiple regression • Use when outcome variable is continuous • Multiple predictors and outcomes • E.g., relationship between various test scores and various student outcomes • Path analysis • Structural equation modeling • Canonical correlations • Factor analysis
What’s Important to Remember • When see use of these statistical tests, know it is correlational research • If Spearman rho or Pearson r it’s looking at correlation between two variables • If Multiple regression or discriminant analysis looking at multiple predictors for one criterion outcome • Factor analysis, path analysis etc…multiple of both
Both variables are continuous Pearson Product One is Dichotomous (nominal) and other is dichotomous (nominal) Phi coefficient Both are ordinal (rank order) Spearman Rho Other combinations (not discussed in this class) Nominal/ ordinal: Rank biserial Nominal/ continuous: Point biserial From Claudia Flowers 10/17/05 Review: Four Options of Variables in Correlational Research
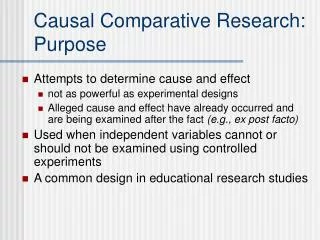
Causal Comparative Designs • Another name is Ex-post-facto designs • Studies that investigate the relationships between independent and dependent variables in situations where it is impossible or unethical to manipulate the independent variable • Example - what is the effect of pre-kindergarten (Pre-K) attendance on first grade achievement • Cannot mandate Pre-K attendance for children • Characteristics and resources of families who do and do not send their children to Pre-K may influence first grade achievement • Similarities with correlational and experimental research designs
When to Use Causal-Comparative • When the independent variable • Should not be manipulated for research purposes (e.g., provision of special education services) • Cannot be manipulated (e.g., disability, gender) • Already occurred (e.g., those who had preschool services vs. those who did not)
Examples of Causal-Comparative • Indep variable not manipulated for what reason (can’t, already occurred, shouldn’t) • What is difference between students with LD and BED on EOG scores in science? • What is difference between students who receive speech therapy and those who do not on a language measure? • What is difference between teachers who are National Board certified and those who are not on number of referrals to special education?
Same: Two or more variables Not an experiment Different: One of the variables is an independent variable Two or more groups Same: Variables Not an experiment Different: Relationship of the two or more variables (not effect of indep on dep) Two or more variables within the same group Compare Causal-Comparative and Correlational Designs
Causal comparative Same: More than one group Independent and dependent variables Use of inferential statistics Different: Independent variable has already occurred (not manipulated) Also called ex-post facto Experimental Same: More than one group Independent and dependent variables Use of inferential statistics Different: Independent variable is manipulated (has not occurred) Compare Experiment vs. Causal Comparative
Causal Comparative Designs • Issues of concern • Selecting participants who are as similar as possible on all characteristics except the independent variable • Generalizing beyond the participants studied • Major difference between causal-comparative and correlation (CC involves two or more groups and typically 1 IV; correlation is two or more variables and one group • Major difference between CC and experimental is that experimental manipulates the IV and CC does not.
Causal Comparative Designs • Criteria for evaluating causal-comparative studies • Primary purpose is to investigate causal relationships when experimental designs are not possible • Presumed causal condition has already occurred • Potential extraneous variables are considered • Existing differences between groups being compared are controlled (matching) • Causal conclusions are made with caution (lack of randomization of treatment, manipulation, control)