Download
1 / 38
380 likes | 401 Views
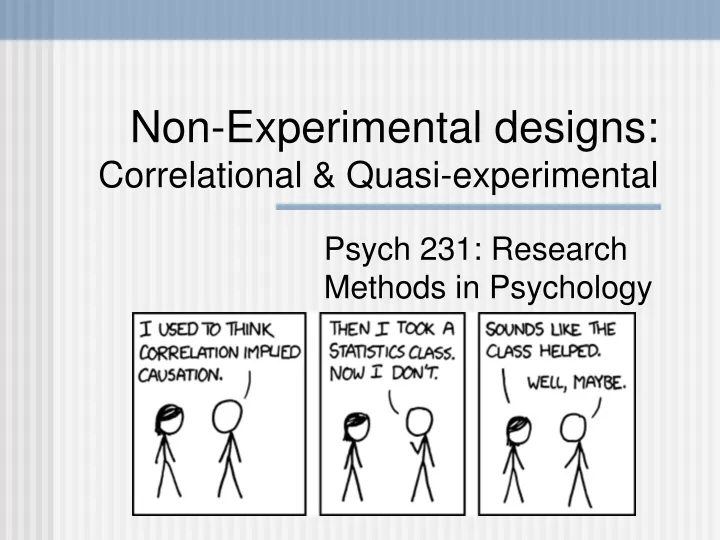
Non-Experimental designs: Correlational & Quasi-experimental. Psych 231: Research Methods in Psychology. Non-Experimental designs: Correlational & Quasi-experimental. Psych 231: Research Methods in Psychology.

E N D
Non-Experimental designs: Correlational & Quasi-experimental Psych 231: Research Methods in Psychology
Non-Experimental designs: Correlational & Quasi-experimental Psych 231: Research Methods in Psychology
Lab attendance is critical this week because group projects are being administered • Attendance will be taken. • Bring what you need (e.g., flash drives & copies of materials) • Don’t forget Quiz 8 due on Friday at midnight • Also don’t forget that you can take quizzes late once each • Post Exam 2 extra credit opportunity (8 points) – posted on ReggieNet, due in-class on Wednesday (11/7) Announcements
Sometimes you just can’t perform a fully controlled experiment • Because of the issue of interest • Limited resources (not enough subjects, observations are too costly, etc). • Surveys • Correlational • Quasi-Experiments • Developmental designs • Small-N designs • This does NOT imply that they are bad designs • Just remember the advantages and disadvantages of each Non-Experimental designs
Y 6 5 4 3 2 1 1 2 3 4 5 6 X • Looking for a co-occurrence relationship between two (or more) variables • Example 1: Suppose that you notice that the more you study for an exam, the better your score typically is. • This suggests that there is a relationship between study time and test performance. • We call this relationship a correlation. • 3 properties: form, direction, strength • For this example, we have a linear relationship, it is positive, and fairly strong Correlational designs
Linear Non-linear Y Y X X Y Y X X Form
Y Y X X Positive Negative • X & Y vary in the same direction • X & Y vary in opposite directions Direction
r = 1.0 “perfect positive corr.” r = 0.0 “no relationship” -1.0 0.0 +1.0 The farther from zero, the stronger the relationship r = -1.0 “perfect negative corr.” Strength: Pearson’s Correlation Coefficient r
Advantages: • Doesn’t require manipulation of variable • Sometimes the variables of interest can’t be manipulated • Allows for simple observations of variables in naturalistic settings (increasing external validity) • Can look at a lot of variables at once Want some examples? Correlational designs
Disadvantages: • Do not make casual claims • Third variable problem • Temporal precedence • Coincidence (random co-occurence) • r=0.52 correlation between the number of republicans in US senate and number of sunspots • From Fun with correlations • See also Spurious correlations • Correlational results are often misinterpreted Correlational designs Correlation is not causation blog posts: Internet’s favorite phrase Why we keep saying it Minute physics (~4 mins)
Example 2: Suppose that you notice that kids who sit in the front of class typically get higher grades. • This suggests that there is a relationship between where you sit in class and grades. Possibly implied: “[All] Children who sit in the back of the classroom [always] receive lower grades than those [each and every child] who sit in the front.” Incorrect interpretation: Sitting in the back of the classroom causes lower grades. Better way to say it: “Researchers X and Y found that children who sat in the back of the classroom were more likely to receive lower grades than those who sat in the front.” Daily Gazzett Children who sit in the back of the classroom receive lower grades than those who sit in the front. Misunderstood Correlational designs Other examples: Psych you mind | PsyBlog
Sometimes you just can’t perform a fully controlled experiment • Because of the issue of interest • Limited resources (not enough subjects, observations are too costly, etc). • Surveys • Correlational • Quasi-Experiments • Developmental designs • Small-N designs • This does NOT imply that they are bad designs • Just remember the advantages and disadvantages of each Non-Experimental designs
What are they? • Almost “true” experiments, but with an inherent confounding variable • General types • An event occurs that the experimenter doesn’t manipulate or have control over • Flashbulb memories for traumatic events • Program already being implemented in some schools • Interested in subject variables • high vs. low IQ, males vs. females • Time is used as a variable • age Relatively accessible article: Harris et al (2006). The use and interpretation of Quasi-Experimental studies in medical informatics Quasi-experiments
Example: The Freshman 15 (CBS story) (Vidette story) • Is it true that the average freshman gains 15 pounds? (Wikipedia) • Recent research says ‘no’ – closer to 2.5 – 3 lbs • Looked at lots of variables, sex, smoking, drinking, etc. • Also compared to similar aged, non college students • College student isn’t as important as becoming a young adult • For a nice reviews see, Zagorsky & Smith (2011) & Brown (2008) Note: the original study was Hovell, Mewborn, Randle, & Fowler-Johnson (1985)(note: they reported the avg gain as 8.8 lbs) Quasi-experimental designs
Independent Variable Dependent Variable Dependent Variable Non-Random Assignment Experimental group Measure Measure participants Control group Measure Measure • Nonequivalent control group designs • with pretest and posttest (most common) (think back to the second control lecture) • But remember that the results may be compromised because of the nonequivalent control group (review threats to internal validity) Quasi-experiments
Advantages • Allows applied research when experiments not possible • Threats to internal validity can be assessed (sometimes) • Disadvantages • Threats to internal validity may exist • Designs are more complex than traditional experiments • Statistical analysis can be difficult • Most statistical analyses assume randomness Quasi-experiments
Program evaluation • Systematic research on programs that is conducted to evaluate their effectiveness and efficiency. • e.g., does abstinence from sex program work in schools • Steps in program evaluation • Needs assessment - is there a problem? • Program theory assessment - does program address the needs? • Process evaluation - does it reach the target population? Is it being run correctly? • Outcome evaluation - are the intended outcomes being realized? • Efficiency assessment- was it “worth” it? The the benefits worth the costs? Quasi-experiments
Used to study changes in behavior that occur as a function of age changes • Age typically serves as a quasi-independent variable • Three major types • Cross-sectional • Longitudinal • Cohort-sequential Developmental designs Video lecture (~10 mins)
Cross-sectional design • Groups are pre-defined on the basis of a pre-existing variable • Study groups of individuals of different ages at the same time • Use age to assign participants to group • Age is subject variable treated as a between-subjects variable Age 4 Age 7 Age 11 Developmental designs
Advantages: • Can gather data about different groups (i.e., ages) at the same time • Participants are not required to commit for an extended period of time • Cross-sectional design Developmental designs
Cross-sectional design Developmental designs
Follow the same individual or group over time • Age is treated as a within-subjects variable • Rather than comparing groups, the same individuals are compared to themselves at different times • Changes in dependent variable likely to reflect changes due to aging process • Changes in performance are compared on an individual basis and overall • Longitudinal design time Age 11 Age 15 Age 20 Developmental designs
Example • Wisconsin Longitudinal Study(WLS) • Began in 1957 and is still on-going (50 years) • 10,317 men and women who graduated from Wisconsin high schools in 1957 • Originally studied plans for college after graduation • Now it can be used as a test of aging and maturation • Data collected in: • 1957, 1964, 1975, 1992, 2004, 2011 Longitudinal Designs
Advantages: • Can see developmental changes clearly • Can measure differences within individuals • Avoid some cohort effects (participants are all from same generation, so changes are more likely to be due to aging) • Longitudinal design Developmental designs
Disadvantages • Can be very time-consuming • Can have cross-generational effects: • Conclusions based on members of one generation may not apply to other generations • Numerous threats to internal validity: • Attrition/mortality • History • Practice effects • Improved performance over multiple tests may be due to practice taking the test • Cannot determine causality • Longitudinal design • Baby boomers • Generation X • Mellennials • Generation Z Developmental designs
Measure groups of participants as they age • Example: measure a group of 5 year olds, then the same group 10 years later, as well as another group of 5 year olds • Age is both between and within subjects variable • Combines elements of cross-sectional and longitudinal designs • Addresses some of the concerns raised by other designs • For example, allows to evaluate the contribution of cohort effects • Cohort-sequential design Developmental designs
Cohort-sequential design Time of measurement 1975 1985 1995 Cohort A 1970s Age 5 Age 5 Age 5 Cross-sectional component Cohort B 1980s Age 15 Age 15 Cohort C 1990s Age 25 Longitudinal component Developmental designs
Advantages: • Get more information • Can track developmental changes to individuals • Can compare different ages at a single time • Can measure generation effect • Less time-consuming than longitudinal (maybe) • Disadvantages: • Still time-consuming • Need lots of groups of participants • Still cannot make causal claims • Cohort-sequential design Developmental designs
Sometimes you just can’t perform a fully controlled experiment • Because of the issue of interest • Limited resources (not enough subjects, observations are too costly, etc). • Surveys • Correlational • Quasi-Experiments • Developmental designs • Small-N designs • This does NOT imply that they are bad designs • Just remember the advantages and disadvantages of each Non-Experimental designs
What are they? • Historically, these were the typical kind of design used until 1920’s when there was a shift to using larger sample sizes • Even today, in some sub-areas, using small N designs is common place • (e.g., psychophysics, clinical settings, animal studies, expertise, etc.) Small N designs
In contrast to Large N-designs (comparing aggregated performance of large groups of participants) • One or a few participants • Data are typically not analyzed statistically; rather rely on visual interpretation of the data Small N designs
= observation • Observations begin in the absence of treatment (BASELINE) • Then treatment is implemented and changes in frequency, magnitude, or intensity of behavior are recorded Steady state (baseline) Treatment introduced Small N designs
= observation • Baseline experiments – the basic idea is to show: • when the IV occurs, you get the effect • when the IV doesn’t occur, you don’t get the effect (reversibility) Transition steady state Reversibility Steady state (baseline) Treatment introduced Treatment removed Small N designs
Before introducing treatment (IV), baseline needs to be stable • Measure level and trend • Level – how frequent (how intense) is behavior? • Are all the data points high or low? • Trend – does behavior seem to increase (or decrease) • Are data points “flat” or on a slope? Unstable Stable Small N designs
ABA design (baseline, treatment, baseline) Steady state (baseline) Transition steady state Reversibility • The reversibility is necessary, otherwise something else may have caused the effect other than the IV (e.g., history, maturation, etc.) • There are other designs as well (e.g., ABAB see figure13.6 in your textbook) ABA design
Advantages • Focus on individual performance, not fooled by group averaging effects • Focus is on big effects (small effects typically can’t be seen without using large groups) • Avoid some ethical problems – e.g., with non-treatments • Allows to look at unusual (and rare) types of subjects (e.g., case studies of amnesics, experts vs. novices) • Often used to supplement large N studies, with more observations on fewer subjects Small N designs
Disadvantages • Difficult to determine how generalizable the effects are • Effects may be small relative to variability of situation so NEED more observation • Some effects are by definition between subjects • Treatment leads to a lasting change, so you don’t get reversals Small N designs
Some researchers have argued that Small N designs are the best way to go. • The goal of psychology is to describe behavior of an individual • Looking at data collapsed over groups “looks” in the wrong place • Need to look at the data at the level of the individual Small N designs