Download
1 / 72
830 likes | 1.07k Views
Educational Research: Correlational Studies. EDU 8603 Educational Research Richard M. Jacobs, OSA, Ph.D. Research. The systematic application of a family of methods employed to provide trustworthy information about problems.

E N D
Educational Research: Correlational Studies EDU 8603 Educational Research Richard M. Jacobs, OSA, Ph.D.
Research... • The systematic application of a family of methods employed to provide trustworthy information about problems …an ongoing process based on many accumulated understandings and explanations that, when taken together lead to generalizations about problems and the development of theories
The basic steps of research... Scientific and disciplined inquiry is an orderly process, involving: recognition and identification of a topic to be studied (“problem”) description and execution of procedures to collection information (“method”) objective data analysis statement of findings (“results”)
Research methods... Quantitative… …collects and analyzes numerical data obtained from formal instruments
Quantitative methods... • descriptive research (“survey research”) • correlational research • causal-comparative research (“ex post facto research”) • experimental research
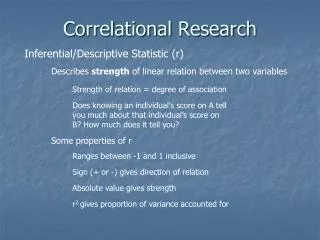
correlational research …determines whether and to what degree a relationship exists between two or more quantifiable variables …the degree of the relationship is expressed as a coefficient of correlation
…the presence of a correlation does not indicate a cause-effect relationship primarily because of the possibility of multiple confounding factors
A correlation study… …a study providing a numerical estimatethe correlation coefficientabout the relationship between two or more variables
Types of correlation studies… • relationship studies… …attempt to gain insight into variables that are related to more complex variables • prediction studies… …conducted to facilitate decisions about individuals, to aid in various types of selection, to test variables believed to be good predictors of a criterion, or to determine predictive validity of measuring instruments
Conducting a correlational study… 1. select the problem 2. select participants and instrument 3. design and procedure 4. data analysis and interpretation
1. select the problem… …the variables to be correlated should be selected on the basis of some rationale …a shotgun or fishing approach is discouraged
2. select participants and instrument… …using an acceptable sampling methodology, a minimum of 30 participants is acceptable …larger samples are used if validity and reliability are important because error measurement may mask the true relationship
3. design and procedure… …two or more scores are obtained for each member of the sample, one score for each variable of interest, and the paired scores are then correlated …the result is expressed as a correlation coefficient
4. data analysis and interpretation… …the two or more scores are obtained for each member of the sample, one score for each variable of interest, and the paired scores are then correlated …the correlation coefficient indicates the degree of relationship between the variables of interest
Correlation coefficient… -1.00 0.00 +1.00 strong positive strong negative no relationship
No correlation… y x
No correlation… y x
statistical significance… …a statement that the relationship between the variables, at a given level of probability (α, alpha), are truly related …is dependent upon the sample size
Conducting relationship studies… Follows the procedure for correlational studies with two adaptations… 1. data collection 2. data analysis and interpretation
relationship studies… …attempt to gain insight into variables that are related to complex variables …indicate whether causal-comparative and experimental studies may determine a causal connection between the variables
1. select the problem… …the variables to be correlated should be selected on the basis of some rationale …identify an appropriate population of participants from which to sample …if needed, administer instrument to collect data
2. data analysis and interpretation… …the scores for one variable are correlated with the scores for another variable and expressed in the form of a correlation coefficient
The method for computing a correlation coefficient… …depends upon the type of data represented by each variable …types of data: nominal (dichotomous) interval (continuous) ordinal (rank) ratio (continuous)
with continuous data… …use the product moment correlation, Pearson r (ρ, rho) • with rank data… …use the rank difference correlation, Spearman r (ρ, rho)
with dichotomous data… …use the phi correlation (ψ) • with curvilinear data… …use the eta correlation (η)
Conducting prediction studies… Follows the procedure for correlational studies with two adaptations… 1. data collection 2. data analysis and interpretation
predictive studies… …when two variables are highly related, scores on one variable can be used to predict scores on the other variable …facilitate decisions about individuals or to aid in various types of selection
predictor variable… …the variable used to predict criterion variable… …the variable predicted
1. data collection… …valid measuring instruments should be carefully selected to represent the variables of interest …it is especially important that the measure used as the criterion variable be valid
2. data analysis and interpretation… …single prediction studies use one predictor …multiple prediction studies use more than one predictor …in both, a continuous predictor variable is used to predict a continuous criterion variable
single prediction studies… Y = a + bX Where Y = predictor criterion X = an individual’s score on the predictor variable a = a constant calculated from the scores of all participants b = the coefficient indicating the contribution of the predictor to the criterion
multiple prediction studies… …use multiple predictors Y = a + bX1 + bX2 + … + bXn Where Y = predictor criterion Xn = an individual’s score on the predictor variable a = a constant calculated from the scores of all participants b = the coefficient indicating the contribution of the predictor to the criterion
discriminant function analysis …similar to multiple regression analysis but a continuous predictor variable is used to predict a categorical variable
path analysis …studies relationships and patterns among a number of variables, yielding a diagram showing the direct or indirect relationships between the variables
structural equation modeling …a sophisticated form of path analysis providing greater theoretical validity and statistical precision clarifying the direct or indirect interrelationships among variables relative to a given variable
canonical correlation …an extension of multiple regression analysis that produces a correlation based on a group of predictor variables and a group of criterion variables
factor analysis (FANOVA) …a statistical method for making sense of a large number of variables …approach: group a larger number of variables into a smaller number of clusters; derive factors by finding groups of variables that are highly among each other, but lowly with other variables; use factors as variables
Mini-Quiz… • True and false… …a high degree of correlation between two variables implies that one causes the other False
…the existence of a high negative correlation permits prediction True
…the correlation coefficient indicates the percentage of relationship between the variables False
…the correlation coefficient indicates the amount of common variance shared by the variables True
…common, or shared, variance indicates the extent to which variables vary in a systematic way True
…the more systematically two variables vary, the lower the correlation coefficient False
…the amount common, or shared, variance is much less than the numerical value of the correlation coefficient True
…for a given sample size, the value of the correlation coefficient needed for significance increases as the level of confidence increases True
…the level of significance indicates the probability that a given relationship is a true one, regardless of whether it is a strong or weak relationship True
…a statistically significant correlation coefficient establishes a cause-effect relationship False
…relationship studies that have not uncovered useful relationships have at least identified variables that can be excluded from future studies, which is a necessary step in science True