Download
1 / 11
140 likes | 214 Views
Correlational Research. Spare the rod and spoil the child Idle hands are the devil’s workplace The early bird catches the worm You can’t teach an old dog new tricks Faint heart never won fair maiden. Nature of Correlational Design?. No manipulation Describes important human behaviors

E N D
Correlational Research Spare the rod and spoil the child Idle hands are the devil’s workplace The early bird catches the worm You can’t teach an old dog new tricks Faint heart never won fair maiden
Nature of Correlational Design? • No manipulation • Describes important human behaviors • Predicts likely outcomes • Involves two or more variables (one dependent and one or more independent variables) • Predictor = independent variable (nAch) • Criterion = dependent variable (mental health)
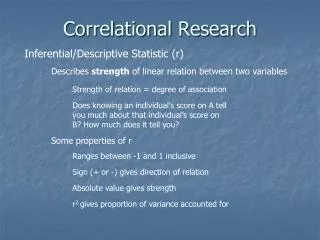
Correlation Coefficient • Existence • Degree • Direction Usually expressed as… • r (simple) or R (multiple) [ -1.00 to 0 to +1.00] • Eta [0.00 to 1.00] – for curvilinear data set Use of scatter plots?
Warning! Relationship does not necessarily indicate cause-effect (causal connection) (it may suggest cause-effect but does not establish one) “the independent variable DOES PLAY A ROLE in the occurrence of the dependent variable…” (but does not necessarily cause it)
Levels of correlation coefficient: • 0.00 to 0.20 Negligible • 0.20 to 0.40 Low • 0.40 to 0.60 Moderate • 0.60 to 0.80 Substantial • 0.80 to 1.00 High to very high (Guiford & Fruchter, 1981)
Prediction The more highly related two variables are, the more accurate are predictions based on their relationships Scatter plot → regression line → regression equation Y = a + bX (simple regression) Y = a + b1X1 +b2X2 + b3X3 (multiple regression) a & b are constants a = intercept b = slope
Standard error of estimate (SE) • Predictor and criterion don’t usually have a perfect correlation • So, an attempt to use X to predict Y is likely to result in a certain degree of error • Y predicted vs. ‘true/actual’ Y (difference in this is known as error score) • The standard deviation of the error scores across all individuals is known as SE Note: the smaller the SE, the more accurate the prediction!
The Coefficient of Determination • Indicates the percentage of the variability (variance) among the criterion scores that can be attributed to differences in the scores on the predictor variable • Coefficient of Determination = r2 x 100% • E.g. r = .60 → r2 x 100% = .36 x 100 = 36% • What does 36% mean? • Especially useful when there are more than one independent variables (predictors)
Steps • Selecting a problem • Choosing a sample (n=30 at least) • Selecting or developing instruments (tests, questionnaires, observation) • Determining procedures • Collecting and analyzing data • Interpreting results (caution!)