Download
1 / 12
130 likes | 145 Views
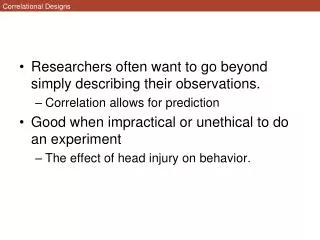
Chapter 9 Correlational Research Designs. What are correlational research designs, and why are they used in behavioral research. What patterns of association can occur between two quantitative variables? What is the Pearson product-moment correlation coefficient? What

E N D
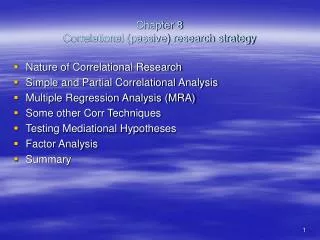
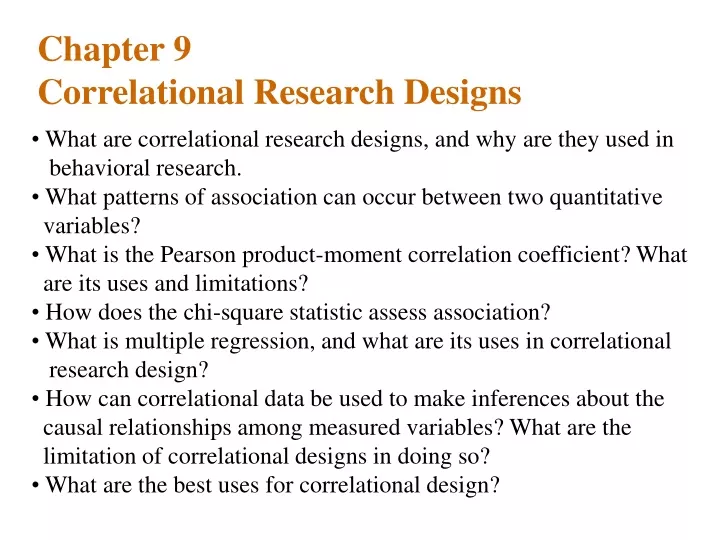
Chapter 9Correlational Research Designs • What are correlational research designs, and why are they used in • behavioral research. • What patterns of association can occur between two quantitative • variables? • What is the Pearson product-moment correlation coefficient? What • are its uses and limitations? • How does the chi-square statistic assess association? • What is multiple regression, and what are its uses in correlational • research design? • How can correlational data be used to make inferences about the • causal relationships among measured variables? What are the • limitation of correlational designs in doing so? • What are the best uses for correlational design?
Statistical Assessment of Relationships Data Are the data quantitative or nominal? quantitative nominal Do you have more than two predictor variables? Do you have more than two predictor variables? No Yes No Yes Correlation Analysis: r Chi-Square Analysis: 2 Log-Linear Analysis Logistic Regression Regression Analysis: R
The Correlation Coefficientfor Association among Quantitative Variables College GPA Scatterplot 4.0 3.0 2.0 1.0 A graph in which the x axis indicates the scores on the predictor variable and the y axis represents the scores on the outcome variable. A point is plotted for each individual at the intersection of their scores. Regression Line A line in which the squared distances of the points from the line are minimized. (least square methods) 1.0 2.0 3.0 4.0 High School GPA
Linear Relationships and Nonliniar Relationships Y Y X Positive Linear Negative Linear X Y Y Y X X Curvilinear Curvilinear X Independent
The Pearson Correlation Coefficient Calculation Esteem 1 Esteem 2 1 4 4 2 4 3 3 3 2 4 2 2 5 2 1 r = (4-3)/0.8 =1.67 [(4-3)(4-2.4)]2 + ... = (4-2.4)2 + ... (4-3)2 + ... Mean 3 2.4 4+4+3+2+2 4 x 4 + 4 x 3 + ... 4+3+2+2+1 Sesteem1 = 0.8 Sesteem2=1.04 5 = Task 1: compute r 4 x 4 + 4 x 4 + 3 x 3 ... 4 x 4 + 3 x 3 + 2 x 2 ...
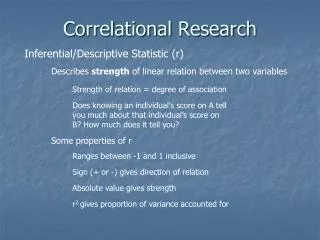
Interpretation of r -1< r <1 0 < r < 1 -1 < r < 0 If the relationship between X and Y are positive: If the relationship between X and Y are negative: If p-value associated with the r is < .05 The variable X and Y are significantly correlate to each other. Positively: 0 < r < 1, Negatively -1 < r < 0 If p-value associated with the r is >. 05 There is no significant correlation between X and Y
Reporting Correlations r(Number of Participants) = Correlation Coefficient r, p < p value. “ As predicted by the research hypothesis, the variable of optimism and reported health behavior were (significantly) positively correlated in the sample (the data), r(20) = .52, p < .01
Limitation 1. Cases in which the correlation between X and Y that have curvilinier relationships r = 0 2. Cases in which the range of variables is restricted. Example. SAT scores and college GPA Restriction of Range 3. Cases in which the data have outliersr > |.99|
Limitation (visual) Curviliniar Small Range Outlier
The Chi-square Statisticfor Association among nominal variables Yes No 30 (.15) 70 (.35) Northerner 100 (.50) 45 (.225) 55 (.275) 60 (.30) 40 (.20) Southerner 100 (.50) 45 (.225) 55 (.275) 90 (.45) 110 (.55) 200 (1.00) Row marginal X Column marginal N X= 2 = Task 2 computation 2
Interpretation of 2 • Go to Table E in Appendix E. • Degree of Freedom (df): • (Level of variable 1 - 1) X (Level of variable 2 -1) • Number of Participants • See the value at the intersection between Alpha p < .05 and df If 2 is greater than the value in Table E, the contingency table is significantly differ from the expectation. If 2 is greater than the value in Table E, the contingency table is not significantly differ from the expectation.
Reporting Chi-Square Statistic 2 (degree of freedom (df), Number of Participants(N)) = Chi value, p < p value As predicted by the research hypothesis, the southerners were more likely to approve of a policeman striking an adult male citizen who was being questioned as a suspect in a murder case, 2(1, N =30) = 34.23, p < .01