Download

1 / 37
390 likes | 422 Views
Correlational Research. Correlational Research. The purpose of correlational research is to discover relationships between two or more variables. Relationship means that an individuals status on one variable tends to reflect his or her status on the other. Correlational Research.

E N D
Correlational Research The purpose of correlational research is to discover relationships between two or more variables. Relationship means that an individuals status on one variable tends to reflect his or her status on the other.
Correlational Research Helps us understand related events, conditions, and behaviors. Is there a relationship between educational levels of parents and children’s learning interest? To make predictions of how one variable might predict another Can high school grades be used to predict college grades?
Correlational Research To examine the possible existence of causation Does physical exercise cause people to lose weight? CAUTION: In correlational research you CAN NOT absolutely say once variable causes something to happen. This can only be done through experimental research. You can say one variable might cause something else to happen.
Warning! Relationship does not necessarily indicate cause-effect (causal connection) (it may suggest cause-effect but does not establish one) “the independent variable DOES PLAY A ROLE in the occurrence of the dependent variable…” (but does not necessarily cause it)
Where does the data come from for correlational research? Surveys Scores on various tests or rating scales Demographic information Judges or expert ratings
Correlational Research Process Variables to be study are identified Questions and/or hypotheses are stated A sample is selected (a minimum of 30 is needed) Data are collected Correlations are calculated Results are reported
Terminology “Predictor” variable – the variable(s) that are believed to predict the outcome. Could be called an independent variable
Terminology “Criterion” variable – the variable to be predicted, the outcome Could be called the dependent variable
Terminology Is level of education (predictor variable) related to family income (criterion variable)? Do people who eat more eggs (predictor variable) have higher cholesterol levels (criterion variable)?
Correlational research in MI • Research Q? • Variables? • Dependent and independent? • Target • Measure? • Gardner’s MI test • BGFL test
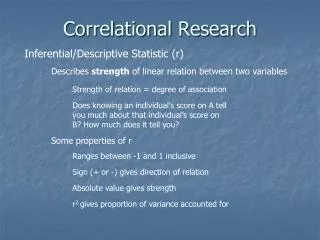
Correlation coefficient • Needed to show the • Existence • Degree • Direction of the correlation Usually expressed as… • r (simple) or R (multiple) [ -1.00 to 0 to +1.00]
Correlations Correlations can range from –1.00 to 1.00 A 1.00 is a perfect positive correlation As one variable increases, so does the other A -1.00 is a perfect negative correlation As one variable increases, the other variable decreases A .00 correlation indicates no correlation There is no relationship between one variable and another
Interpretation of the Strength of Correlations .00 - .20 – Very Weak .21 - .40 – Weak .41 - .60 – Moderate .61 - .80 – Strong .81 – 1.00 - Very Strong Different statisticians may have similar but slightly different scales.
Correlations Scatter plots are often used to depict correlations This chart shows a strong positive correlation
Correlations Scatter plots are often used to depict correlations This chart shows a strong negative correlation
Correlations Scatter plots are often used to depict correlations This chart shows virtually no correlation
How can I calculate correlations? Excel has a statistical function. It calculates Pearson Product Moment correlations. SPSS (a statistical software program for personal computers used by graduate students) calculates correlations.
Which correlation to use? Phi correlation Pearson Product Moment Spearman rho Biserial Correlation Kendall tau
Pearson Product-Moment Correlation Used when both the criterion and predictor variable contain continuous interval data such as test scores, years of experience, money, etc.
Point Biserial Correlation When the predictor variable is a natural (real) dichotomy (two categories) and the criterion variable is interval or continuous, the point biserial correlation is used.
Biserial Correlation When the predictor variable is an artificial dichotomy (two categories) and the criterion variable is interval or continuous , the biserial correlation is used.
Phi Correlation When the both the predictor and criterion variables are natural dichotomies (two categories), the phi correlation is used. If the dichotomies are artificial, the tetrachoric correlation is used. This is rarely the case in educational research
Spearman rho and Kendall tau When the both the predictor and criterion variables are rankings, use either the Spearman rho or Kendall tau correlation. More than 20 cases – Spearman rho Less than 20 cases – Kendall tau
Examples of when to use the Spearman rho or Kendall tau Correlation!
Other Correlations You can perform multiple correlations using such approaches as partial correlation, multiple regression, discriminant analysis, and factor analysis. These are outside the scope of this class.
How can I calculate correlations? Excel has a statistical function. It calculates Pearson Product Moment correlations. SPSS (a statistical software program for personal computers used by graduate students) calculates correlations.
Correlation Principles to Remember For each individual in the research, there must be at least two measures, or it will be impossible to calculate a correlation.
Correlation Principles to Remember A correlation may be statistically significant (it didn’t happen by chance) but be weak or low which means it is nothing to get excited about. It has no practical significance.
More Principles to Remember A correlation is reported asr such as r=.36.
More Principles to Remember The statistical probability is reported as p. Some researchers report the probability of the correlation happening by chance was p>.05 (more than 5 out of 100) or p<.05 (less than 5 out of 100) – we hope for the later as researchers Other researchers report the actual probability; p=.03 The first approach was used before the age of computers Either approach is acceptable.
More Principles to Remember In reporting correlations in research reports you report both the r value and the p.