Download
1 / 52
520 likes | 525 Views
Non-Experimental designs: Surveys & Correlational. Psych 231: Research Methods in Psychology. Quiz 8 is due Friday at midnight Running your group projects in labs this week. Please be there, your participation is important!. Reminders. Mean = 71.6 Median = 74 Max = 94 Min = 35.

E N D
Non-Experimental designs: Surveys & Correlational Psych 231: Research Methods in Psychology
Quiz 8 is due Friday at midnight • Running your group projects in labs this week. • Please be there, your participation is important! Reminders
Mean = 71.6 • Median = 74 • Max = 94 • Min = 35 • Most common errors • Between vs. within designs • Random vs. confound variables • Main effects vs. interactions Extra-credit (8 points) Exam 2 results In ReggieNet Resources, extra credit opportunity. “Exam2_extra_credit.docx” Must be turned in in-class on Nov. 7
Sometimes you just can’t perform a fully controlled experiment • Because of the issue of interest • Limited resources (not enough subjects, observations are too costly, etc). • Surveys • Correlational studies • Quasi-Experiments • Developmental designs • Small-N designs • This does NOT imply that they are bad designs • Just remember the advantages and disadvantages of each Finish up Start Non-Experimental designs
Stage 1) Identify the focus of the study and select your research method • Stage 2) Determining the research schedule and budget • Stage 3) Establishing an information base • Stage 4) Identify the sampling frame • Stage 5) Determining the sample method and sampling size • Review Probability and Non-Probability methods • Voluntary response method • Importance of sample size 11 Stages of survey research
Stage 6) Designing the survey instrument • Question construction: How the questions are written is very important • Clearly identify the research objectives; what constructs are you trying to measure? • Do your questions really target those research objectives (think Internal and External Validity)? • Take care wording of the questions • Keep it simple, don’t ask two things at once, avoid loaded or biased questions, etc. • Be aware of potential framing effects • Framing effect examples (e.g., glass half full/half empty) • How should questions be answered (question type)? 11 Stages of survey research
Problem: emotionally charged words Good Poor Was the FDC negligent by ignoring the warnings about Vioxx during testing and approving it for sale? • Yes • No • Unsure Do you favor eliminating the wasteful excess in the public school budget? • Yes • No • Unsure If the FDC knew that Vioxx caused serious side effects during testing, what should it have done? • Ban it from ever being sold • Require more testing before approving it • Unsure Do you favor reducing the public school budget? • Yes • No • Unsure Good and poor questions
Good Poor Should senior citizens be given more money for recreation centers and food assistance programs? Yes No Unsure Should senior citizens be given more money for recreation centers? Yes No Unsure Should senior citizens be given more money for food assistance programs? Yes No Unsure Problem: asks two different questions Good and poor questions
Good Poor Are you against same sex marriage and in favor of a constitutional amendment to ban it? • Yes • No • Unsure What is your view on same sex marriage? • I think marriage is a matter of personal choice • I’m against it but don’t want a constitutional amendment • I want a constitutional amendment banning it Problem: Asks two questions Good and poor questions
Question types • Open-ended (fill in the blank, short answer) • Can get a lot of information, but • Coding is time intensive and potentially ambiguous • Close-ended (pick best answer, pick all that apply) • Easier to code • Same response alternatives for everyone • Take care with your labels • Decide what kind of scale • Decide number/label of response alternatives What is the best thing about ISU? What is the best thing about ISU? (choose one) • 1. Location • 2. Academics • 3. Dorm food • 4. People who sell things between Milner and the Bone Survey Questions
PSY 231 is an important course in the major. 1 2 3 4 5 Strongly Agree Neutral Disagree Strongly Agree Disagree • Semantic differential: Rate how you feel about PSY 231 on these dimensions Important _____: _____: _____: _____: _____: Unimportant Boring _____: _____: _____: _____: _____: Interesting • Nonverbal scale for children: Point to the face that shows how you feel about the toy. Survey Questions: Close-ended • Decide what kind of rating scales • Rating: e.g., Likert scale
Agreement? Strongly Disagree No Opinion Strongly Agree 1 - 2 - 3 - 4 - 5 - 6 1 - 2 - 3 - 4 - 5 1 - 2 - 3 - 4 - 5 1 - 2 - 3 - 4 - 5 - 6 - 7 Strongly support and would vote for? Strongly support (Yes / No) Strongly Yes Strongly No Don’t support Would vote for Survey Questions: Close-ended • Decide number/label of response alternatives • Use odd number (mid point and equal # of responses above and below the mid point) • Questions should be uni-dimensional (each concerned with only one thing) • Labels should be clear
Stage7) Pre-testing the survey instrument • Fix what doesn’t seem to be working • Stage8) Selecting and training interviewers • For telephone and in-person surveys • Need to avoid interviewer bias • Stage9) Implementing the survey • Stage10) Coding and entering the data • Stage11) Analyzing the data and preparing a final report 11 Stages of survey research
Sometimes you just can’t perform a fully controlled experiment • Because of the issue of interest • Limited resources (not enough subjects, observations are too costly, etc). • Surveys • Correlational • Quasi-Experiments • Developmental designs • Small-N designs • This does NOT imply that they are bad designs • Just remember the advantages and disadvantages of each Non-Experimental designs
Looking for a co-occurrence relationship between two (or more) variables • Used for • Descriptive research • do behaviors co-occur? • Predictive research • is one behavior predictive of another? • Reliability and Validity • Does your measure correlate with others (and itself)? • Evaluating theories • Look for co-occurrence posited by the theory. Correlational designs
Looking for a co-occurrence relationship between two (or more) variables • Example 1: Suppose that you notice that the more you study for an exam, the better your score typically is • At a descriptive level this suggests that there is a relationship between study time and test performance. • For our example, which variable is explanatory and which is response? And why? • It depends on your theory of the causal relationship between the variables • Explanatory variables (Predictor variables) • Response variables (Outcome variables) Correlational designs
Y 6 5 4 3 2 1 1 2 3 4 5 6 X • For this example, we have a linear relationship, it is positive, and fairly strong Scatterplot
Y 6 5 4 3 2 1 1 2 3 4 5 6 X Response (outcome) variable • For descriptive case, it doesn’t matter which variable goes where • Correlational analysis • For predictive cases, put the response variable on the Y axis • Regression analysis Explanatory (predictor) variable Scatterplot
Y 6 5 4 3 2 1 1 2 3 4 5 6 X • Looking for a co-occurrence relationship between two (or more) variables • We call this relationship a correlation. • 3 properties: form, direction, strength • For this example, we have a linear relationship, it is positive, and fairly strong Correlational designs
Linear Non-linear Y Y X X Y Y X X Form
Y Y X X Positive Negative • X & Y vary in the same direction • X & Y vary in opposite directions Direction
r = 1.0 “perfect positive corr.” r = 0.0 “no relationship” -1.0 0.0 +1.0 The farther from zero, the stronger the relationship r = -1.0 “perfect negative corr.” Strength
Advantages: • Doesn’t require manipulation of variable • Sometimes the variables of interest can’t be manipulated • Allows for simple observations of variables in naturalistic settings (increasing external validity) • Can look at a lot of variables at once Example 2: The Freshman 15(CBS story) (Vidette story) • Is it true that the average freshman gains 15 pounds? • Recent research says ‘no’ – closer to 2.5 – 3 lbs • Looked at lots of variables, sex, smoking, drinking, etc. • Also compared to similar aged, non college students For a nice review see Brown (2008) Correlational designs Zagorsky (2011)
Disadvantages: • Don’t make casual claims • Third variable problem • Temporal precedence • Coincidence (random co-occurrence) • r=0.52 correlation between the number of republicans in US senate and number of sunspots • From Fun with correlations • Correlational results are often misinterpreted Correlational designs Correlation is not causation blog posts: Internet’s favorite phrase Why we keep saying it
Example 3: Suppose that you notice that kids who sit in the front of class typically get higher grades. • This suggests that there is a relationship between where you sit in class and grades. Daily Gazzett Children who sit in the back of the classroom receive lower grades than those who sit in the front. Possibly implied: “[All] Children who sit in the back of the classroom [always] receive worse grades than [each and every child] who sits in the front.” Better: “Researchers X and Y found that children who sat in the back of the classroom were more likely to receive lower grades than those who sat in the front.” Misunderstood Correlational designs Example from Owen Emlen (2006) Other examples: Psych you mind | PsyBlog
Sometimes you just can’t perform a fully controlled experiment • Because of the issue of interest • Limited resources (not enough subjects, observations are too costly, etc). • Surveys • Correlational • Quasi-Experiments • Developmental designs • Small-N designs • This does NOT imply that they are bad designs • Just remember the advantages and disadvantages of each Non-Experimental designs
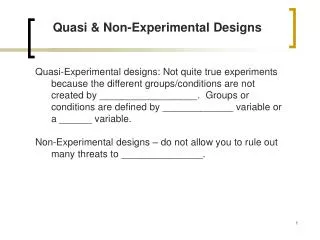
What are they? • Almost “true” experiments, but with an inherent confounding variable • General types • An event occurs that the experimenter doesn’t manipulate • Something not under the experimenter’s control • (e.g., flashbulb memories for traumatic events) • Interested in subject variables • high vs. low IQ, males vs. females • Time is used as a variable Relatively accessible article: Harris et al (2006). The use and interpretation of Quasi-Experimental studies in medical informatics Quasi-experiments
Advantages • Allows applied research when experiments not possible • Threats to internal validity can be assessed (sometimes) • Disadvantages • Threats to internal validity may exist • Designs are more complex than traditional experiments • Statistical analysis can be difficult • Most statistical analyses assume randomness Quasi-experiments
Program evaluation • Research on programs that is implemented to achieve some positive effect on a group of individuals. • e.g., does abstinence from sex program work in schools • Steps in program evaluation • Needs assessment - is there a problem? • Program theory assessment - does program address the needs? • Process evaluation - does it reach the target population? Is it being run correctly? • Outcome evaluation - are the intended outcomes being realized? • Efficiency assessment- was it “worth” it? The the benefits worth the costs? Quasi-experiments
Independent Variable Dependent Variable Dependent Variable Non-Random Assignment Experimental group Measure Measure participants Control group Measure Measure • Nonequivalent control group designs • with pretest and posttest (most common) (think back to the second control lecture) • But remember that the results may be compromised because of the nonequivalent control group (review threats to internal validity) Quasi-experiments
Interrupted & Non-interrupted time series designs • Observe a single group multiple times prior to and after a treatment Obs Obs Obs Obs Treatment Obs Obs Obs Obs • Look for an instantaneous, permanent change • Interrupted – when treatment was not introduced by researcher, for example some historical event • Variations of basic time series design • Addition of a nonequivalent no-treatment control group time series O O O T O O O & O O O _ O O O • Interrupted time series with removed treatment • If treatment effect is reversible Quasi-experiments
Advantages • Allows applied research when experiments not possible • Threats to internal validity can be assessed (sometimes) • Disadvantages • Threats to internal validity may exist • Designs are more complex than traditional experiments • Statistical analysis can be difficult • Most statistical analyses assume randomness Quasi-experiments
Sometimes you just can’t perform a fully controlled experiment • Because of the issue of interest • Limited resources (not enough subjects, observations are too costly, etc). • Surveys • Correlational • Quasi-Experiments • Developmental designs • Small-N designs • This does NOT imply that they are bad designs • Just remember the advantages and disadvantages of each Non-Experimental designs
Used to study changes in behavior that occur as a function of age changes • Age typically serves as a quasi-independent variable • Three major types • Cross-sectional • Longitudinal • Cohort-sequential Developmental designs
Cross-sectional design • Groups are pre-defined on the basis of a pre-existing variable • Study groups of individuals of different ages at the same time • Use age to assign participants to group • Age is subject variable treated as a between-subjects variable Age 4 Age 7 Age 11 Developmental designs
Advantages: • Can gather data about different groups (i.e., ages) at the same time • Participants are not required to commit for an extended period of time • Cross-sectional design Developmental designs
Cross-sectional design Developmental designs
Follow the same individual or group over time • Age is treated as a within-subjects variable • Rather than comparing groups, the same individuals are compared to themselves at different times • Changes in dependent variable likely to reflect changes due to aging process • Changes in performance are compared on an individual basis and overall • Longitudinal design time Age 11 Age 15 Age 20 Developmental designs
Example • Wisconsin Longitudinal Study(WLS) • Began in 1957 and is still on-going (50 years) • 10,317 men and women who graduated from Wisconsin high schools in 1957 • Originally studied plans for college after graduation • Now it can be used as a test of aging and maturation Longitudinal Designs
Advantages: • Can see developmental changes clearly • Can measure differences within individuals • Avoid some cohort effects (participants are all from same generation, so changes are more likely to be due to aging) • Longitudinal design Developmental designs
Disadvantages • Can be very time-consuming • Can have cross-generational effects: • Conclusions based on members of one generation may not apply to other generations • Numerous threats to internal validity: • Attrition/mortality • History • Practice effects • Improved performance over multiple tests may be due to practice taking the test • Cannot determine causality • Longitudinal design Developmental designs
Measure groups of participants as they age • Example: measure a group of 5 year olds, then the same group 10 years later, as well as another group of 5 year olds • Age is both between and within subjects variable • Combines elements of cross-sectional and longitudinal designs • Addresses some of the concerns raised by other designs • For example, allows to evaluate the contribution of cohort effects • Cohort-sequential design Developmental designs
Cohort-sequential design Time of measurement 1975 1985 1995 Cohort A 1970s Age 5 Age 5 Age 5 Cross-sectional component Cohort B 1980s Age 15 Age 15 Cohort C 1990s Age 25 Longitudinal component Developmental designs
Advantages: • Get more information • Can track developmental changes to individuals • Can compare different ages at a single time • Can measure generation effect • Less time-consuming than longitudinal (maybe) • Disadvantages: • Still time-consuming • Need lots of groups of participants • Still cannot make causal claims • Cohort-sequential design Developmental designs
What are they? • Historically, these were the typical kind of design used until 1920’s when there was a shift to using larger sample sizes • Even today, in some sub-areas, using small N designs is common place • (e.g., psychophysics, clinical settings, expertise, etc.) Small N designs
One or a few participants • Data are typically not analyzed statistically; rather rely on visual interpretation of the data • Observations begin in the absence of treatment (BASELINE) • Then treatment is implemented and changes in frequency, magnitude, or intensity of behavior are recorded Small N designs
Baseline experiments – the basic idea is to show: • when the IV occurs, you get the effect • when the IV doesn’t occur, you don’t get the effect (reversibility) • Before introducing treatment (IV), baseline needs to be stable • Measure level and trend Small N designs
Level – how frequent (how intense) is behavior? • Are all the data points high or low? • Trend – does behavior seem to increase (or decrease) • Are data points “flat” or on a slope? Small N designs
ABA design (baseline, treatment, baseline) • The reversibility is necessary, otherwise something else may have caused the effect other than the IV (e.g., history, maturation, etc.) ABA design
Advantages • Focus on individual performance, not fooled by group averaging effects • Focus is on big effects (small effects typically can’t be seen without using large groups) • Avoid some ethical problems – e.g., with non-treatments • Allows to look at unusual (and rare) types of subjects (e.g., case studies of amnesics, experts vs. novices) • Often used to supplement large N studies, with more observations on fewer subjects Small N designs