Understanding Scatterplots in Data Analysis
140 likes | 231 Views
Learn how to plot and analyze two variables in a model, distinguish independent and dependent variables, and interpret the X and Y-axis units. Explore examples and insights on plotting data over time.

Understanding Scatterplots in Data Analysis
E N D
Presentation Transcript
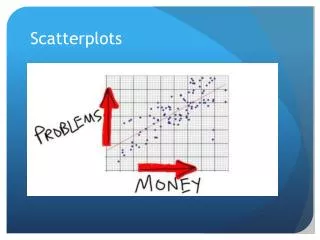
Scatterplots • Display two variables • Independent variable - X • Does not depend on any other variable in the model • Dependent variable - Y • Depends upon one or more independent variables in the model
Model Causes Y X Independent Dependent
Look at the graph • Where is the X axis? • Where is the Y axis? • What are the units of the X axis? • What are the units of the Y axis? • How is one case represented?
The X axis X-axis
The Y axis Y-axis X-axis
The Units • What are the units of the variables of interest? • Are the variables measurement variables? • Are the variables ordinal variables? • Are the variables categorical variables? • Cannot graph unless change/create units • For example % Republican for party choice
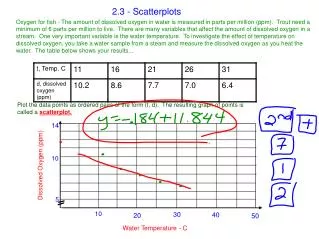
Plot a case • What is the Y value for the case? • What is the X value for the case? • Example: • X = 1964 • Y = 603 total catch • Or • Y1 = 603 total catch • Y2 = 142 Canadian catch
Plot the Case (x,y) or (1964,603) 603 1964
Example • Cities • X - % unemployment • Y - crime rate • Persons • X - amount of prejudice • Y - amount of discrimination
What about time? • Time, though itself is not the direct cause of any outcome, all outcomes are a function of time • Thus, time may be thought of as an • Independent variable? • Dependent variable?
Time is an IV • Time is an independent variable, since outcomes are dependent upon time • If time is an independent variable, how would we graph an outcome over time? • Time as the X axis? • Time as the Y axis?
Time on the X axis • Any variable that is a function of time can be placed on the Y axis • Lets look at the codfish landings off Newfoundland from 1960 to 1994 • file newfcod.dta • total, Canadian, Allowed • file whales.dta • Blue, Fin, Sei
Plot on time or obs. num. • Look at example of each for whale data. • Are years equally spaced? • What if they are not? • What conclusions do you come to?
Scatterplots (not time) • Same principles, plot the X and Y values for each case using the units of the original data. • Examples • Voting on environmental issues by House and Senate in 50 states (file: envote.dta): describe • Voting by region: describe