Scatterplots and Correlation
660 likes | 916 Views
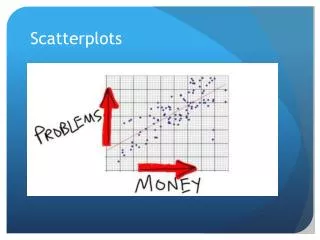
Scatterplots and Correlation. two quantitative variables. Type of Coffee and amount of Caffeine. Interested in the relationship between them. Form. Direction. Strength. Dots close to a line. Dots really spread out.

Scatterplots and Correlation
E N D
Presentation Transcript
Type of Coffee and amount of Caffeine
Strength Dots close to a line Dots really spread out
We want to examine whether the amount of rainfall per year increases or decreases corn bushel output. A sample of 10 observations was taken, and the amount of rainfall (in inches) was measured, as was the subsequent growth of corn.
Dependent Var? Independent Var? Form? Direction? Strength? Outliers? What does this tell us?
Sign on r matches direction of the scatterplot data. r = +0.9 r = -0.8
Only for straight-line relationships. Brain Functionality Age
-1 -0.8 -0.5 0 0.5 0.8 1 Strong Mod Weak Mod Strong Measures direction and strength of the linear relationship Demo Game
The correlation between corn yield and amount of rain is 0.995 Describe strength of the correlation. What does this imply?
R2 The PERCENT of the dependent variable that is explained by the independent variable
Given R2 What is the correlation (careful of sign)
In our example, R2is 99.06% What does that mean?
Goal: go through “middle” of points minimize residuals
Intercept Slope
What is the predicted corn yield if rain = 3 in? y = 50.83 + 9.63 x
What is the predicted corn yield if rain = 3 in? y = 50.83 + 9.63 x y = 50.83 + 9.63 (3) = 79.72 bushels of corn
Data close to line – more accurate predictions (i.e. r close to 1 or -1, R2 close to 100%)
On the rain/corn data above, predict the corn yield for • 5 inches of rain • 7.2 inches of rain • 0 inches of rain • 100 inches of rain
X = 5 Predict: 98.96 bushels of corn Prediction Safe
X=7.2 Predict: 120.135 bushels of corn “prediction” Pretty safe
X=0 Predict: 50.835 bushels of corn Extrapolation unsafe
X=100 Predict: 1013.335 bushels of corn Extrapolation unsafe