Download
1 / 9
90 likes | 220 Views
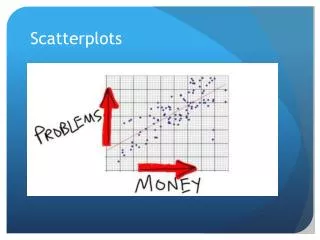
Scatterplots. Key Definitions. Correlation : A measure of how closely the points on a scatterplot fit the line. Can be strong/weak, positive/negative. You are travelling at 100km/h. Time and Distance are the two variables. Distance travelled, d, depends on the time, t.

E N D
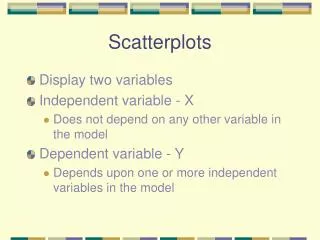
Key Definitions • Correlation: A measure of how closely the points on a scatterplot fit the line. Can be strong/weak, positive/negative. You are travelling at 100km/h. Time and Distance are the two variables. Distance travelled, d, depends on the time, t. In d = 100t, t is the independent variable and d is the dependent variable. Dependent is always plotted on the y axis and Independent on the x axis.
Key Definitions • Data set is Continuous if a variable can be any real number. Ex. volume of water vs. time under the tap. • Data set is Discrete if a variable cannot be any real number. Ex. Footballs sold in NS during the month of May.
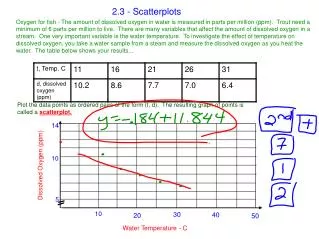
Application • Draw a line of best fit • Describe the relationship between volume of gasoline and amount paid • Is the data discrete or continuous? • Determine the equation of the line of best fit. What does the slope represent? • Using the equation, determine the cost of 10L of gas. Cost for 60L?
Linear or Non Linear Data? • Line of Best fit vs. Curve of Best Fit
Practice • Page 379 • #1 – 4 • Page 380 • #3, 10, 15, 17