Scatterplots
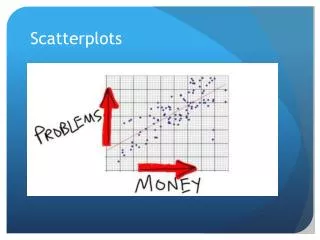
Scatterplots. AP Statistics CH . 7 EQ: How do we graph bivariate data?. Scatterplots. Help to observe relationships between two quantitative variables(we call this describing bivariate data) Should have title, labels, units

Scatterplots
E N D
Presentation Transcript
Scatterplots AP Statistics CH. 7 EQ: How do we graph bivariate data?
Scatterplots • Help to observe relationships between two quantitative variables(we call this describing bivariate data) • Should have title, labels, units • Can see patterns, trends, relationships, extraordinary values
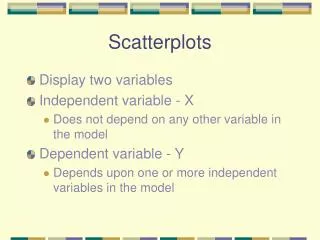
Describing patterns • Form-clusters, gaps, curved, linear, etc • Strength-weak, strong, spread • Direction(association)-positive or negative • Unusual features-outliers, data far away from the rest
Response Variable (Dependent) • Measures an outcome of a study • In a scatterplot it goes on the y axis • Explanatory/Predictor Variable (Independent) -Attempts to explain the observed outcome -In a scatterplot it goes on the x axis
If there is a relationship, tell which is the explanatory and response variables. • The amount of time spent studying and the grade on the exam • The weight and height of a person. • The amount of yearly rainfall and the yield of a crop. • Maximum daily temperature and average monthly heating bills.
Principles • Start with a graph • Look for a pattern and deviations • Add numerical descriptions • Describe the overall pattern briefly
The high temperature in degree Fahrenheit and coffee sales (in hundreds of dollars) for a coffee shop for eight randomly selected days.
Tell which variable is explanatory and which is response. • Graph the scatterplot. Describe it. C. Explain in a sentence what this says about high temperatures and coffee sales.
Book P. 164 # 2 Suppose you want to collect data for each pair of variables. You want to make a scatterplot. Which variable would be the explanatory variable and which would be the response variable? Discuss the likely direction, form, and strength. A. T-shirts at a store: price each, number sold • Skin diving: depth, water pressure • Skin diving: depth, visibility • All elementary-school students: weight, score on a reading test
Book P. 164 # 6 Which scatterplot has • Little or no association • A negative association • A linear association • A moderately strong association • A very strong association
HW P. 164 # 3, 5, 9, 11