Scatterplots & Correlation
Scatterplots & Correlation. Section 3.1A. Relationships between two Variables. A study found that short women are more likely to have heart attacks than tall women…. Smokers on average die younger than nonsmokers….

Scatterplots & Correlation
E N D
Presentation Transcript
Scatterplots & Correlation Section 3.1A
Relationships between two Variables • A study found that short women are more likely to have heart attacks than tall women…. • Smokers on average die younger than nonsmokers…. • But – to make these conclusions we must first eliminate the effect of other variables.
Lurking Variables • Can strongly influence the relationship between two variables.
Variables • Response Variable • Measures the outcome of a study. • It’s the dependent variable. • Explanatory Variable • May help explain or influence changes in a response variable. • It’s the independent variable.
Identify the explanatory and response variable. • How does drinking beer affect the level of alcohol in our blood? The legal limit for driving in all states is 0.08%. In a study, adult volunteers drank different numbers of cans of beer. Thirty minutes later, a police officer measured their blood alcohol levels.
Identify the explanatory and response variable. • The National Student Loan Survey provides data on the amount of debt for recent college graduates, their current income, and how stressed they feel about college debt. A sociologist looks at the data with the goal of using amount of debt and income to explain the stress caused be college debt.
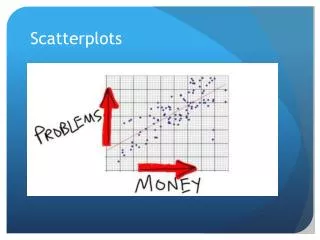
Scatterplot • Used to show the relationship between two quantitative variables measured on the same individuals. Each individual in the data appears as a point in the graph. • Explanatory variable goes on the horizontal axis. • If there is no explanatory variable then either variable can go on the horizontal axis.
The following data represents 9th grade students who go on a backpacking trip.
Interpreting Scatterplots • Look for direction (positive, negative, none) • Look at the form of the relationship • Straight or curved • Any clusters • Look at the Strength • How closely does it follow the form • Look for outliers • Individual value hat falls outside the overall pattern of the relationship
Caution….. Association does not imply causation!
Interpret…. Direction Form Strength Outliers
Homework • Page 159 (1-13) odd