Download

1 / 13
130 likes | 157 Views
Explore the correlation method with various examples like income vs. education, happiness vs. helpfulness, and more. Understand the strength and direction of relationships in quantitative data analysis.

E N D
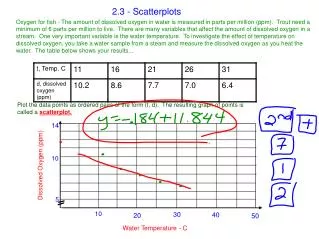
This table shows some sample data. Each person reported income and years of education. 1. SAT scores and college achievement—among college students, those with higher SAT scores also have higher grades 2. Happiness and helpfulness—as people’s happiness level increases, so does their helpfulness (conversely, as people’s happiness level decreases, so does their helpfulness)
We find that people with higher income have more years of education. (You can also phrase it that people with more years of education have higher income.) When we know there is a correlation between two variables, we can make a prediction. If we know a group’s income, we can predict their years of education. the correlation is .79
Is there a correlation between TV viewing and class grades? 1. Education and years in jail—people who have more years of education tend to have fewer years in jail (or phrased as people with more years in jail tend to have fewer years of education) 2. Crying and being held—among babies, those who are held more tend to cry less (or phrased as babies who are held less tend to cry more)
the correlation is -.63. There is a negative correlation between TV viewing and class grades—students who spend more time watching TV tend to have lower grades
Disadvantage Advantage An advantage of the correlation method is that we can make predictions about things when we know about correlations. If two variables are correlated, we can predict one based on the other. For example, we know that SAT scores and college achievement are positively correlated. So when college admission officials want to predict who is likely to succeed at their schools, they will choose students with high SAT scores. The problem that most people have with the correlation method is remembering that correlation does not measure cause. Take a minute and chant to yourself: Correlation is not Causation! Correlation is not Causation!
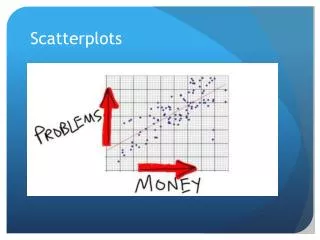
Correlation is NOT Causation • Predicting outcome through stats...
Scatterplot of student volunteer with their BAC vs Beer intake
Correlation measures the strength of a linear relationship. Patterns closer to a straight line have correlations closer to 1 or -1
More facts about correlation: • Correlation requires that both variables be quantitative. • “r” does not describe curved relationships between variables, no matter how strong they are. • Like the mean and standard deviation, the correlation is not resistant: r is strongly affected by few outliers. • Correlation is not a complete summary of two-variable data.(unless you list down the means and sd of both x and y)
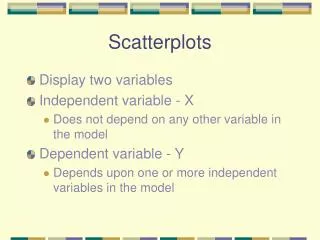
A scatterplot displays the relationship between two quantitative variables measured on the same individuals. (x = explanatory variable and y= response variable) • Plot points with different colors or symbols to see the effect of a categorical variable in a scatterplot. • In examining a scatterplot, always look for an overall patter showing direction, form, strength and then look for outliers or other deviation from this pattern. • Direction: either positive or negative • Form: when the points show a straight-line relationship, the pattern is said to be linear which is an important relationship between variables. • Strength: determined by how close the points in the scatterplots.
Correlation r measures the strength and direction of linear association between 2 quantitative variables. If r > 0 then the linear relationship has a positive association If r < 0 then the linear relationship has a negative association -1 ≤ r ≤ 1, perfect correlation is when r = ± 1 which only occurs if the points lie on a straight line.