Scatterplots and Correlation
Scatterplots and Correlation. Section 3.1 Part 2 of 2 Reference Text: The Practice of Statistics , Fourth Edition. Starnes, Yates, Moore. SAT Activity: Remember?. Lets have a quick discussion on what was the important factors when writing a description: Reminder of what we did :


Scatterplots and Correlation
E N D
Presentation Transcript
Scatterplotsand Correlation Section 3.1 Part 2 of 2 Reference Text: The Practice of Statistics, Fourth Edition. Starnes, Yates, Moore
SAT Activity: Remember? • Lets have a quick discussion on what was the important factors when writing a description: Reminder of what we did: • Write your most recent SAT math and verbal scores on a slip of paper and drop in the box as I pass through the room. • Write a description of the association between math and verbal scores.
Describing Associations • Four main concepts make up the description of an association between two variables: linear, relationship, direction, and Context. • Linear or not (form): is a description of the shape of the graph • A straight line is typical, but not the only shape possible. • Relationship (strength): is a description of how clearly the data follow the form stated. • Direction: is positive or negative and agrees with the slope of the line • In positive associations, an increase in the explanatory variable leads to an increase in the response variable • Context: Always report your answers in context of the problem! Communication is HUGE factor in AP Stats
Today’s Objectives • Part 1: • Identify variables as explanatory or response variables • Given a two-variable data set, construct and interpret a scatterplot • Describe an association in terms of: • Linear or not (does it look linear or not?!) • Relationship: weak, moderate, strong (are the data points all over the place?) • Direction: pos or neg (slope!) • Context • Part 2: • Correlation (r): -1 < r < 1
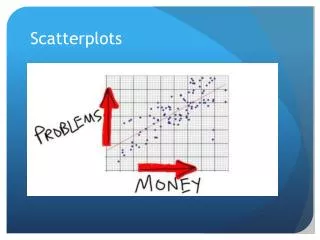
Comparing Scatterplots • Consider the two scatterplots to the right. • They both show positive linear association. • Are they about the same strength? • Clearly not, so how can we quantify the difference?
Measuring Linear Association: Correlation Scatterplots and Correlation
The Correlation Constant • Since we can use mean or median to quantify the center of a distribution. • And we can use standard deviation or IQR to quantify the spread of a distribution. • So then, In the same spirit, we quantify the strength of a linear association with a number. • It is called the Correlation Constant, abbreviated by the letter r
The numbers are called the correlation coefficient and are used to determine the strength of the relation. 1 is a perfect positive correlation 0 is no correlation (values don’t seem linked at all) -1 is a perfect negative correlation
What does the formula mean? • Essentially we are averaging the product of the x and y z-scores • Definition: • The correlation r measures the strength of the linear relationship between two quantitative variables. • r is always a number between -1 and 1 • r > 0 indicates a positive association. • r < 0 indicates a negative association. • Values of r near 0 indicate a very weak linear relationship. • The strength of the linear relationship increases as r moves away from 0 towards -1 or 1. • The extreme values r = -1 and r = 1 occur only in the case of a perfect linear relationship.
Lets tryThe local ice cream shop keeps track of how much ice cream they sell versus the noon temperature on that day. Compute the r value with TI 83:
Measuring Linear Association: Correlation Scatterplots and Correlation
Correlation Does NOT Imply Causation • Think about it…. In a study of college freshmen, researchers found that students who watched TV for an hour or more on weeknights were significantly more likely to have high blood pressure, compared to those students who watched less than an hour of TV on weeknights. Does this mean that watching more TV raises one’s blood pressure? Explain your reasoning. Ask yourself…. What possible outside factors could be in play here? Do those factors have more logical reasoning as to effect blood pressure? Moral of the story… Just because there is a correlation, DOES NOT imply that one variable causes the effect of the other! There can be a lurking variable – another factor that could be influencing the cause of a variable.
Another Example Least-Squares Regression Correlation Does Not Imply Causation An association between an explanatory variable x and a response variable y, even if it is very strong, is not by itself good evidence that changes in x actually cause changes in y. A serious study once found that people with two cars live longer than people who only own one car. Owning three cars is even better, and so on. There is a substantial positive correlation between number of cars x and length of life y. Why?
Facts about Correlation How correlation behaves is more important than the details of the formula. Here are some important facts about r. Scatterplots and Correlation Correlation makes no distinction between explanatory and response variables. r does not change when we change the units of measurement of x, y, or both. The correlation r itself has no unit of measurement. • Cautions: • Correlation requires that both variables be quantitative. • Correlation does not describe curved relationships between variables, no matter how strong the relationship is. • Correlation is not resistant. r is strongly affected by a few outlying observations. • Correlation is not a complete summary of two-variable data.
Correlation Practice For each graph, estimate the correlation r and interpret it in context. Scatterplots and Correlation
Today’s Objectives • Part 1: • Identify variables as explanatory or response variables • Given a two-variable data set, construct and interpret a scatterplot • Describe an association in terms of: • Linear or not (does it look linear or not?!) • Relationship: weak, moderate, strong (are the data points all over the place?) • Direction: pos or neg (slope!) • Context • Part 2: • Correlation (r): -1 < r < 1
Test Results! 3A • Grade: Amount: Marginal % • ……A......……...1..……….5% • …….B…………..4…….....20% 50% Passed • …….C…………..5……....25% • …….D………….…2…....10% • …….F…..............…8….40% 50% Failed • Mean:63.45 % Max: 91% Min: 16% No Outliers
Test Results! 6B • Grade: Amount: Marginal % • ……A......……..3...……….18% • …….B…………..1…….....6% 42% Passed • …….C…………..3……....18% • …….D…………...3……....18% • …….F….............7.……….41% 59 % Failed • Mean: 64.53% Max: 98% Min: 24% No Outliers
Tracking AP Stats • 2018-2019 (WHS) • Ch. 1 Test Ch. 2 Test Ch. 3 Test • A 2/2 A 1/3 • B 11/3 B 4/1 • C8/1 C5/3 • D8/8 D2/3 • F1/4 F8/7
Homework 3.2 Homework Worksheet Continue working on Chapter 3 Reading guide