Exploring Relationships in Bivariate Statistical Studies
140 likes | 234 Views
Learn about bivariate statistical studies analyzing relationships among multiple variables for the same group of individuals. Understand correlations, variables, and interpreting scatterplots. Discover how to examine data, identify patterns, and calculate correlations effectively.

Exploring Relationships in Bivariate Statistical Studies
E N D
Presentation Transcript
3.1: Scatterplots • So far: 1-variable statistics. Side-by-side boxplots, stemplots, & histograms made comparisons visible. • Now: statistical studies w/more than 1 variable (=bivariate!). We will be concentrating on relationships among several variables for the same group of individuals. • Example: How is an SAT math score related to an SAT verbal score?
Preliminary Questions • What individuals does the data describe? • What are the variables? (How are they measured?) • Are the variables quantitative or categorical? • Do you want to explore the nature of the relationship, or do you think that some of the variables explain – or even cause – changes in the others?
Correlation Info… • r>0 = positive association; r<0 = negative association. r always falls between –1 and 1. Values near 0 = weak linear relationship. As values near 1 or –1, the strength of the relationship increases and points lie closer to a straight line. • r does not change when we change the units of measurement for x, y, or both. • r has no unit of measurement. • r measures the strength of linear relationships only (not curved). • r is strongly affected by outlying observations. • Correlation is not a complete description of 2-variable data; always give the mean and standard deviation along with r.
More on the variables… • There may or may not be explanatory or response variables; depends on how you want to use the data. • Calling one variable explanatory and the other response doesn’t necessarily mean that changes in one cause the changes in the other.
Example • Jim wants to know how the median SAT math and verbal scores are related to each other. He doesn’t think either score explains or causes the other. Which one is the explanatory variable? • Julie has the same data. She wants to know if she can predict a state’s SAT math score if she knows its SAT verbal score. Which one is the explanatory and which one is the response?
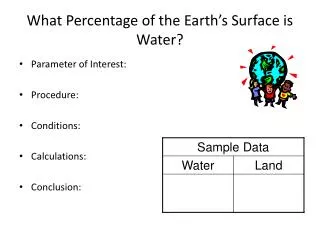
Principles guiding examination of data • Start with a graph • Look for an overall pattern/deviations from the pattern • Add numerical descriptions of specific aspects of the data • Look for a way to describe the overall pattern very briefly.
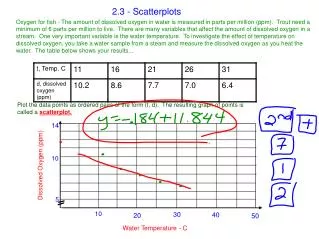
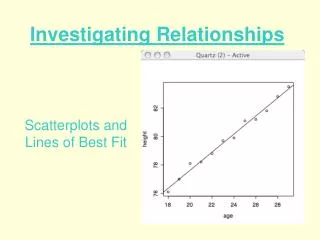
Scatterplot • Shows the relationship between two quantitative variables • Always plot the explanatory variable (if there is one) on the horizontal axis (x-axis), and the response variable on the vertical axis (y-axis) of a scatterplot. • If there is no explanatory-response distinction, either variable can go on either axis.
Interpreting Scatterplots: Overall pattern • Form: Linear Direction: Positively Associated Strength: Put in L1 to find r!
Is there a correlation between the number of beers a student consumes and their BAC? • Find the vital stats • Describe the form, direction, and strength • Draw the graph
Example • Competitive divers are scored from 1-10. We have the scores of two judges, Ivan and George, on a large number of dives. After calculating, we find that r = .9. However, the mean of Ivan’s scores are 3 points lower than George’s mean. Do these facts contradict each other?