Yeast Knockout Collection Heat Ramp Assays Plate Images
10 likes | 96 Views
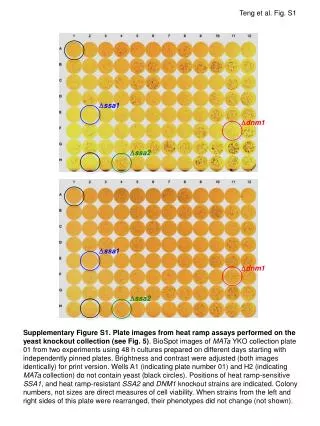
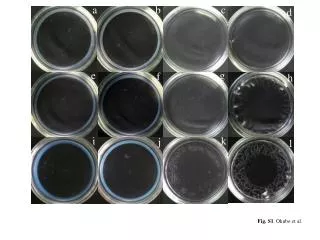
Supplementary Figure S1 showing plate images from heat ramp assays on yeast knockout collection in MATa YKO plate 01. Images from two experiments depict colonies' viability. SSA1, SSA2, and DNM1 knockout strains' positions are highlighted.

Yeast Knockout Collection Heat Ramp Assays Plate Images
E N D
Presentation Transcript
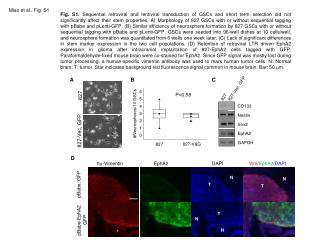
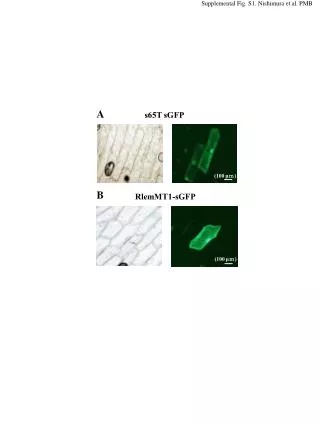
Teng et al. Fig. S1 Dssa1 Ddnm1 Dssa2 Dssa1 Ddnm1 Dssa2 Supplementary Figure S1. Plate images from heat ramp assays performed on the yeast knockout collection (see Fig. 5). BioSpot images of MATa YKO collection plate 01 from two experiments using 48 h cultures prepared on different days starting with independently pinned plates. Brightness and contrast were adjusted (both images identically) for print version. Wells A1 (indicating plate number 01) and H2 (indicating MATa collection) do not contain yeast (black circles). Positions of heat ramp-sensitive SSA1, and heat ramp-resistant SSA2 and DNM1 knockout strains are indicated. Colony numbers, not sizes are direct measures of cell viability. When strains from the left and right sides of this plate were rearranged, their phenotypes did not change (not shown).


![[Fig. S1]](https://cdn3.slideserve.com/6448662/slide1-dt.jpg)