Impact of EphA2 on Glioma Stem Cells
70 likes | 163 Views
Investigation of EphA2 effects on stem cell properties and invasion in glioma models using retroviral transduction and mutation. Demonstration of EphA2's role in stem marker expression and invasion in brain slices. EphA2 inhibition reduces invasiveness. EphA2 overexpression enhances invasion in vivo and ex vivo. EphA2 knockdown inhibits chemotactic migration towards EGF and bFGF. S897A mutation abolishes neurosphere formation.

Impact of EphA2 on Glioma Stem Cells
E N D
Presentation Transcript
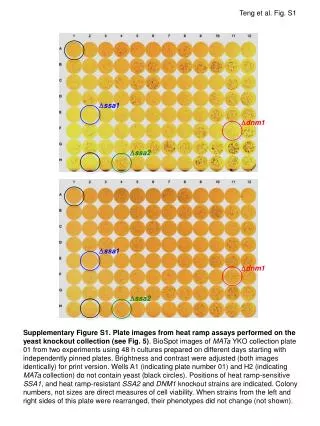
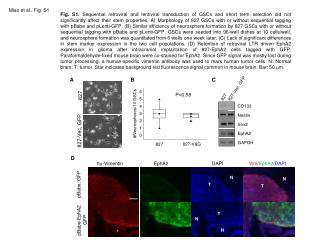
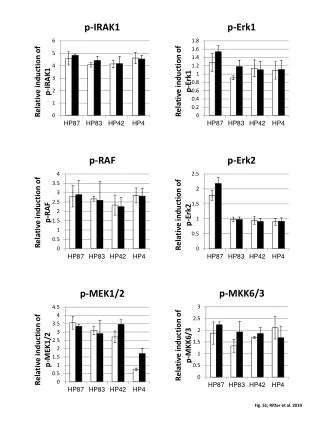
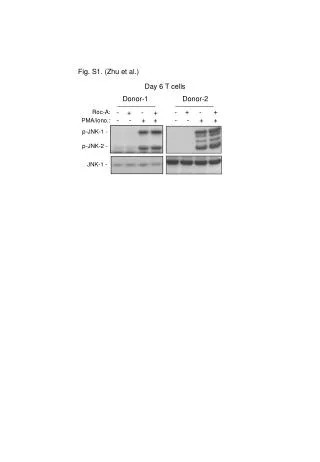
Miao et al., Fig. S1 Fig. S1. Sequential retroviral and lentiviral transduction of GSCs and short term selection did not significantly affect their stem properties. A) Morphology of 827 GSCs with or without sequential tagging with pBabe and pLenti-GFP. (B) Similar efficiency of neurosphere formation by 827 GSCs with or without sequential tagging with pBabe and pLenti-GFP. GSCs were seeded into 96-well dishes at 10 cells/well, and neurosphere formation was quantitated from 6 wells one week later. (C) Lack of significant differences in stem marker expression in the two cell populations. (D) Retention of retroviral LTR driven EphA2 expression in glioma after intracranial implantation of 827-EphA2 cells tagged with GFP. Paraformaldehyde-fixed mouse brain were co-stained for EphA2. Since GFP signal was mostly lost during tumor processing, a human-specific vimentin antibody was used to mark human tumor cells. N: Normal brain; T: tumor. Star indicates background red fluorescence signal common in mouse brain. Bar: 50 mm. 827-Vec, GFP 827 A B C CD133 P=0.58 827 Nestin Sox2 827-Vec, GFP EphA2 GAPDH D hu-Vimentin EphA2 DAPI Vim/EphA2/DAPI N N pBabe, GFP T T T pBabe-EphA2 GFP N N *
Miao et al., Fig. S2 Fig. S2. S897A mutation of EphA2 inhibits the invasiveness of GSCs in vivo. GSC cells (line 1228) were infected with WT- or S897A-EphA2 and tagged with eGFP or mCherry, respectively. Equal number of the two types of cells were mixed and injected into the lateral ventricles of neonatal NOD/SCID mouse brains. Mice were sacrificed 2 weeks post-injection and consecutive coronal sections were prepared from each brain. GSC cell invasion was examined under fluorescent microscope. Shown is a representative image of distant invasion. Note more WT EphA2-expressing 1228 cells were detected at the distant sites away from injection sites than S897A mutant EphA2-expressing cells (arrow heads). White arrow heads point to some red tumor cells. Scale bar, 300 mm. WT-EphA2 S897A-EphA2 WT-EphA2 S897A-EphA2
Miao et al., Fig. S3 Fig. S3. Overexpression of EphA2 promotes invasion of glioma stem cells in vivo. GSC 1228 (A) and D456MG cells (B) were infected with vector- or WT-EphA2 and tagged as indicated. Equal number of the two types of cells were mixed and injected into the lateral ventricles of neonatal NOD/SCID mouse brains. Mice were sacrificed 2 weeks for 1228 cells and 1 month for D456MG cells post-injection and consecutive coronal sections were prepared from each brain. GSC cell invasion was examined under fluorescent microscope. Representative brain sections show that more WT EphA2-expressing 1228 cells were detected in the distant area away from injection sites than vector control cells. More subpial and perineural invasion were seen in WT-EphA2-expressing D456MG cells than vector control cells. Scale bars, 300 mm in A and 200 mm in B. A Vector WT-EphA2 VectorWT-EphA2 VectorWT-EphA2 DAPI B Vector WT-EphA2 Subpial invasion Perineural Invasion
Miao et al., Fig. S4 Fig. S4. Ex vivo invasion of brain slice by GSCs was significantly enhanced by deletion of ephrin-As in tumor microenvironment. Brain slices were prepared from neonatal littermates either wild-type or homozygous knockout for ephrin-A1, -A3, and –A4 (Efna1/a3/a4+/+ or Efna1/a3/a4-/-). Two thousands of GSC 1228-EphA2-mCherry cells were implanted in the cortical region near the corpus callosum. The invasion of GSCs was monitored under epifluorescent microscope. Images were collected at the indicated times. Scale bar, 300 mm. 3 h 24 h 72 h 48 h Efna1,a3,a4+/+ Efna1,a3,a4-/-
Miao et al., Fig. S5 Fig. S5. Ex vivo invasion of brain slice by GSCs was significantly enhanced by deletion of ephrin-As in tumor microenvironment. Brain slices were prepared from neonatal littermates either heterozygou or homozygous knockout for ephrin-A1, -A3, and –A4 (Efna1/a3/a4+/- or Efna1/a3/a4-/-). Ten thousands of GSC 827-GFP (A) or 1228-EphA2-mCherry cells (B) were implanted in the cortical region near the corpus callosum. The invasion of GSCs was monitored under epifluorescent microscope. Images were collected at the indicated times. Scale bar, 500 mm. B A 3 h 24 h 48 h 3 h 24 h 48 h Slice 1 Slice 1 Efna1/a3/a4+/- Efna1/a3/a4+/- Slice 2 Slice 2 Slice 1 Slice 1 Efna1/a3/a4-/- Efna1/a3/a4-/- Slice 2 Slice 2
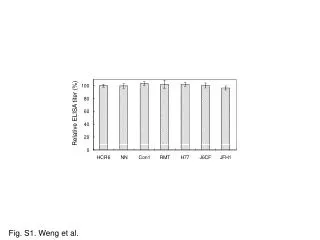
Miao et al., Fig. S6 Fig. S6.EphA2 shRNA knockdown inhibited chemotactic migration of GSCs toward to EGF and bFGF. The 827 GSCs were infected with lentivirus expressing EphA2 shRNA or control shRNA and subjected to Boyden chamber cell migration assay. 20 ng/ml EGF or bFGF was added to the lower chamber as chamoattractants. Cells were allowed to migrate for 4 hours. The result is a representative of three independent experiments. Values represent mean number of cells per field ± s.d. from six random fields. ***, p < 0.001 compared to control.
Miao et al., Fig. S7 New Legend: Fig. S7. S897A mutation in EphA2 abrogates its ability to promote neurosphere formation in GSC 1228 and D456MG cells. (A) The indicated number of 1228 GSC cells were seeded in triplicates in the 6-well (for 1000 cells) or 9 wells in the 96-well (for 100 cells) ultra-low adhesive plates. The number of neurospheres and number of wells with sphere formation were counted 7 - 9 days after plating. *, p < 0.05; **, p < 0.01 compared WT- with S897A mutant EphA2. (B) D456MG cells expressing WT or S897A mutant EphA2 were seeded at 1 or 10 cells/well on 96-well dishes. Number of wells with neurosphere formation was counted 7 - 9 days after plating. Shown is the % wells with neurospheres from 24wells. 1228 456 A B


![[Fig. S1]](https://cdn3.slideserve.com/6448662/slide1-dt.jpg)