Download
1 / 6
60 likes | 194 Views
Pathiraja, et al. Supp. Fig. S1. TRIM24 expression in TCGA BRCA. A. B. Top 30% vs. Bottom 70%. p-value : 1.32e-07. log2 FC (Invasive carcinoma/normal). p-value : 1.46e-08; Odds ratio : 0.43. p-value : 0.047; odds ratio : 1.40. p-value : 3.8e-04; Odds ratio : 1.98. Paired Samples.

E N D
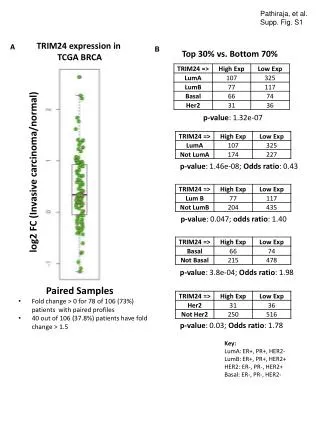
Pathiraja, et al. Supp. Fig. S1 TRIM24 expression in TCGA BRCA A B Top 30% vs. Bottom 70% p-value: 1.32e-07 log2 FC (Invasive carcinoma/normal) p-value: 1.46e-08; Odds ratio: 0.43 p-value: 0.047; odds ratio: 1.40 p-value: 3.8e-04; Odds ratio: 1.98 Paired Samples • Fold change > 0 for 78 of 106 (73%) patients with paired profiles • 40 out of 106 (37.8%) patients have fold change > 1.5 p-value: 0.03; Odds ratio: 1.78 Key: LumA: ER+, PR+, HER2- LumB: ER+, PR+, HER2+ HER2: ER-, PR-, HER2+ Basal: ER-, PR-, HER2-
Pathiraja, et al. Supp. Fig. S2 A * *** (n =3) B
Pathiraja, et al. Supp. Fig. S3 Control TRIM24-1 TRIM24-2
Pathiraja, et al. Supp. Fig. S4 A B C
Pathiraja, et al. Supp. Fig. S5 MCF7 MDA-MB-231 *** *** *** siTRIM24 siTRIM24 siCtrl siCtrl TRIM24 Actin SKBR3 siTRIM24 siCtrl
Pathiraja, et al. Supp. Fig. S6 A B Control Control TRIM24-1 TRIM24-1 C TRIM24-2 TRIM24-2 D E F G H