Download
1 / 30
310 likes | 407 Views
Explore how Indian railways influenced market integration between 1860-1920 using econometric tests and historical data. Discover the railways' contribution to price convergence and market dynamics.

E N D
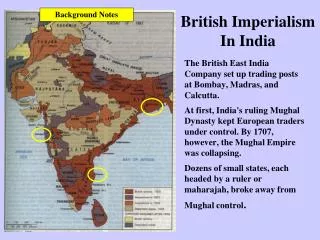
Railways and Market Integration in British IndiaJanuary 2007Comments Welcome Tahir Andrabi and Michael Kuehlwein Pomona College
Main Questions: • Did India have an integrated market between 1860-1920? • How much did railways contribute to market integration?
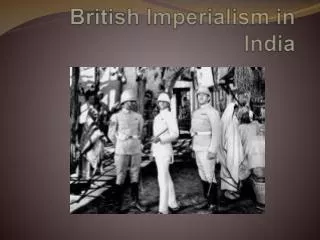
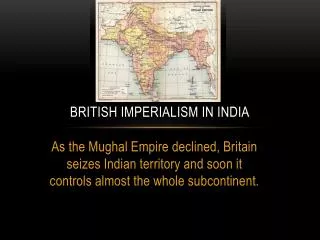
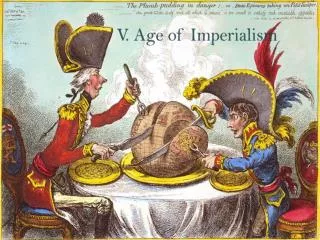
Big Picture • Scale and Scope • Colonialism and the British • Did the British Unite India? • Benign Neglect, Famine, Victorian Holocaust
Big Picture, contd. GIPR ghat loco Y43, SS class 4-6-0ST in 1863. Scan provided by John Lacey. http://www.irfca.org/
Market Integration • PPP • How wide is the border?
Literature (contd.) • US: Atack and Passel (1994) • Russia: Metzer (1974) • India: Hurd (1975), Whitcomb and Hurd (1983), Indian Famine Commission of 1901, McAlpin (1974), Latham and Neal (1983), Collins (1999) • Results mixed for India. • Methodologically, somewhat mixed
Preview of the Results • Did India have an integrated market between 1860-1920? • YES! • How much did railways contribute to market integration? • NOT A WHOLE LOT!
INDIAN RAILWAY DETAILS • First trains: 1853 in Bombay, 1854 in Calcutta • Miles of track: • 1860: 838 • 1870: 4,771 • 1880: 9,162 • 1890: 16,401 • 1900: 24,751 • 1910: 32,099 By 1873, the largest 20 cities had railroads and were linked to each other
DATA • Annual retail wheat price data by district between 1860 and 1920 • Collected fortnightly at district headquarter • 114 districts with data in 1861 • 162 districts with data by 1920 • Two samples: • 114 districts with complete data from 1861-1920 • 147 districts with complete data from 1873-1913
DATA (contd.) • Years districts got railways from 1947 History of Indian Railways • Population data from Indian Census of 1872 • Distance measures from maps
TIME SERIES TESTS • Market integration implies stable long-run relationship in relative wheat prices and mean reversion in deviations from that long-run relationship • Market segmentation: permanent relative price changes
TIME SERIES TESTS (Contd.) • Simple test: unit root in relative wheat prices • (1)qi,t = i + iqi,t-1 + i,t • qi,t: log price of district i at time t minus mean log • price across districts at time t • i:district specific constant • i,t: error term with different variance and serial • correlation across districts • Null: unit root so i=0
TIME SERIES TESTS (Contd.) • Panel unit root tests have higher power • Levin-Lin: common β in alternative to null • Im-Pesaran-Shin: β can vary across districts
Table Levin-Lin Panel Unit Root Tests Sample t-star p-value p ^ Approximate half-life (years) Price Level Test 1861-1920 (114 districts) -37.544 0.000 0.506 1.019 Inflation Rate Test 1862-1920 (114 districts) -98.358 0.000 -0.133 * Price Level Test 1874-1913 (149 districts) -28.417 0.000 0.544 1.140 Inflation Rate Test 1875-1913 (149 districts) -77.352 0.000 -0.103 * Notes: The price level is the deviation of the log price from the mean log price each year. The inflation rate is the deviation of the difference in log prices (current minus lagged) from the mean difference in log prices each year.
Market Integration Results • Markets were integrated • Short half life
ESTIMATING RAILWAYS’ CONTRIBUTION • Our method: measuring their impact on absolute (log) price differentials (APDs) between district pairs • 114 districts: 6,441 district pairs a year • 147 districts: up to 10,731 district pairs a year
ESTIMATING RAILWAYS’ CONTRIBUTION TO MARKET INTEGRATION • econometric specification: • APDj,k,t = α + β1 BothRailj,k,t +Σβj,kDj,k + µj,k,t • BothRail j,k,t: dummy variable = 1 when districts j and k have railways in year t • D j,k: fixed effects dummy variable for each district pair
Table 2Absolute Price Dispersion with District Pair Fixed Effects
Table 2 Absolute Price Dispersion with District Pair Fixed Effects
Figure 5: Price Dispersion Before and After Railways 0.35 Mean Absolute Price Dispersion 0.3 0.25 0.2 0.15 0.1 0.05 0 -20 -15 -10 -5 0 5 10 15 20 Years Before or After Railway Connection
CONCLUSIONS • Wheat markets were integrated in India between 1860-1920 • Significant price convergence during this period • Railways’ contribution to that convergence appears to be relatively small: 10% • Railways effect is comparable to being on the Ganges or the coast
Potential Endogeneity • Direction of bias ? • Economic • Military • Humanitarian • Likely bias to reinforce small effect of railways • Can do some more work • Potential instrument
Further Work • Rice Data • Political boundaries matter too, so perhaps institutional integration contributed significantly to economic integration • Other technological breakthroughs such as telegraphs may have been important