Download
1 / 25
250 likes | 632 Views
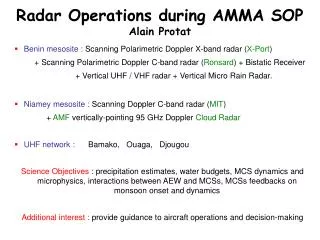
NEXRAD or WSR-88D [Next Generation Radar] [ W eather S urveillance R adar, 19 88 , D oppler]. Pulse Lengths for WSR-88D Radar [ W eather S urveillance R adar, 19 88 , D oppler]. Range Resolution: Long Pulse: Short Pulse: .

E N D
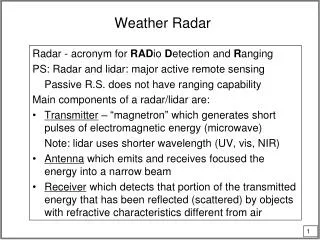
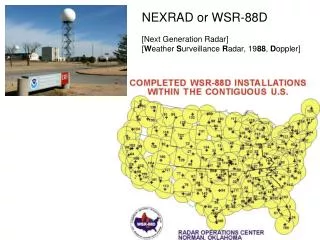
NEXRAD or WSR-88D [Next Generation Radar] [Weather Surveillance Radar, 1988, Doppler]
Pulse Lengths for WSR-88D Radar[Weather Surveillance Radar, 1988, Doppler] • Range Resolution: • Long Pulse: • Short Pulse:
Basic Volume Coverage Patterns (VCP) for the WSR-88D (NEXRAD) Radar
Volume Coverage Maps VCP-21 VCP-31
How to read the intensity scale Extreme Intense Severe Heavy Moderate Light Very light Light Precipitation Very light precipitation Fog, Clouds, Smoke Units are decibels of Z: 10 log10 (Z) (Effective Reflectivity Factor) Precipitation Mode Scale Clear-Air Scale
Typical Images Clutter
Clear-Air Mode Gulf Coast Sea-Breeze (South of Tallahassee) sea breeze smoke plume from wild fire
INTERACTION BETWEEN A WILDFIRE AND A SEA-BREEZE FRONT Hanley, Cunnigham, and Goodrick
Ground Clutter • prevalent on 0.5° reflectivity and velocity images • beam is striking stationary ground targets • area of uniform returns surrounding radar site • Velocities usually near zero on velocity images • Some is filtered but it is impossible to remove it all • Especially bad during inversions
Beam Spreading • beam widens away from the radar. If a small storm is a considerable distance from the radar...it may not be big enough to completely fill the beam. • appears that the storm is filling the entire beam — exaggerates storm size Actual Depicted
Products Available • Reflectivity Images • Velocity Images (Doppler) • Precipitation Estimates • Vertically Integrated Liquid • Echo Tops • Animated Loops of Most Products • Many Other Products
Reflectivity Images Base Reflectivity and Composite Reflectivity Base Reflectivity Composite Reflectivity • Displays the maximum returned signal from all of the elevation scans • Better summary of precipitation intensity • Much less deceiving than Base Reflectivity • Subtle 3-D storm structure hidden • 0.5° elevation slice • Shows only the precipitation at the lowest tilt level • May underestimate intensity of elevated convection or storm cores
Reflectivity Images Composite Reflectivity Displays the maximum returned signal from all of the elevation scans to form a single image Can often mask some Base Reflectivity signatures such as a hook echo
Base vs Composite Reflectivity Which is which? Base Reflectivity Image Composite Reflectivity Image • Notice the heavier returns and more coverage • Notice the lighter returns
Velocity Imagery Warm colors are winds moving away from radome (reds, +) Cool colors are winds moving toward radome (greens, -) Wind speed is in knots Tight area of opposing winds (+ and -) can indicate convergence or rotation. Circled area called a couplet. Indicates a possible tornado.
Hail Detection • Returns > 55 dBz usually indicate hail. • However, the probability of hail reaching the ground depends on the freezing altitude. • Usually, a freezing level above 14,000 feet will not support much hail. • This is because the hail melts before reaching the ground. • Freezing level can be determined from an upper air sounding.
Hail? Max return of 60 dBZ Max return of 65 dBZ Freezing level was 7,000 feet Freezing level was 17,000 feet Produced golf ball sized hail Produced no hail Hence, hail production depends directly on freezing level.
Vertically Integrated Liquid (VIL) • Take a vertical column of the atmosphere: estimate the amount of liquid water in it. • High VIL values are a good indication of hail • The white pixel indicates a VIL of 70. • This storm produced golfball size hail. • Trouble with VIL is that the operator has to wait for the scan to complete before getting the product.
The Hail Spike Also called Three-Body Scattering • A dense core of wet hail will reflect part of the beam to the ground, which then scatters back into the cloud, and is bounced back to the antenna. • The delayed returns trick the radar into displaying a spike past the core. • Usually, will only result from hail 1 inch in diameter or larger (quarter size).
Echo Tops Fairly accurate at depicting height of storm tops Inaccurate data close to radar because there is no beam angle high enough to see tops. Often has stair-stepped appearance due to uneven sampling of data between elevation scans.
Precipitation Estimates Storm TotalPrecipitation • Total estimated accumulation for a set amount of time. • Totals are in inches • Time range is sometimes listed on image. • Resets storm total whenever there is no rain detected for an hour.
One Hour Precipitation Total • -Updated once per volume scan. • Shows accumulated rainfall for the last hour. • Useful for determining rainfall rate of ongoing convection.
Precipitation Estimates Advantages and Limitations • Great for scattered areas of rain where no rain gauges are located • Has helped issue flash flood warnings more efficiently • Helps fill in the holes where ground truth information is not available • Much better lead time for warnings • Provides a graphical ‘map’ of rainfall for an entire region • Data can be overlaid with terrain and watersheds to predict reservoir and waterway crests • Estimates based on cloud water levels and not ground level rainfall • ‘Hail Contamination’ causes highly inflated values • High terrain causes underestimates • Lower resolution than reflectivity images • Useful as a supplement, not replacement for ground truth information