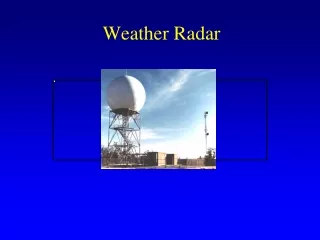
Weather Radar Data
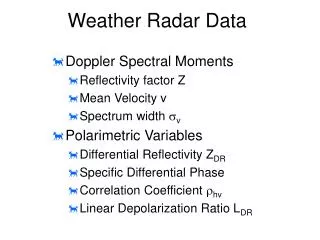
Weather Radar Data. Doppler Spectral Moments Reflectivity factor Z Mean Velocity v Spectrum width v Polarimetric Variables Differential Reflectivity Z DR Specific Differential Phase Correlation Coefficient hv Linear Depolarization Ratio L DR.

Weather Radar Data
E N D
Presentation Transcript
Weather Radar Data • Doppler Spectral Moments • Reflectivity factor Z • Mean Velocity v • Spectrum width v • Polarimetric Variables • Differential Reflectivity ZDR • Specific Differential Phase • Correlation Coefficient hv • Linear Depolarization Ratio LDR
Contributors to Measurement Errors*1) Widespread spatial distribution of scatterers (range ambiguities)*2) Large velocity distribution (velocity ambiguities)3) Antenna sidelobes 4) Antenna motion*5) Ground clutter (regular and anomalous propagation)*6) Non meteorological scatterers (birds, etc.)*7) Finite dwell time 8) Receiver noise*9) Radar calibration *--- these can be somewhat mitigated
Mitigation of Range Ambiguities Uniform PRTs Alternate batches of long (for Z) and short (for velocity) PRTS. El = 19.5o Long PRTs (first PPI scan) for reflectivity ra>460 km; Short PRTs (second PPI scan) for velocity, ra <200km; typically 150 km 7 Scans = 5.25 = 4.3 5 Scans = 2.4 = 1.45 4 Scans = 0.5
Reflectivity Field of Widespread Showers(Data displayed to 460 km)
Velocity Field: Widespread Showers (5dB overlaid threshold; data displayed to 230 km)
Measurements of Rain • R(Z) relations • Error sources • Procedure on the WSR-88D
Reflectivity Factor Rainfall Rate Relations Marshall-Palmer: Z = 200 R1.6 Z(mm6 m-3); R(mm h-1) For WSR-88D: Z = 300 R1.4 - convective rain Z = 200 R1.2 - tropical rain
Rain Rate Error Sources • *1) Radar calibration • 2) Height of measurements • *3) Attenuation • 4) Incomplete beam filling • *5) Evaporation • *6) Beam blockage • 7) Gradients of rain rate • 8) Vertical air motions • *9) Variability in DSD
DSDs, R(Z), and R(disdrometer) Sep 11, 1999 Log(N) Log(N)
DSD’s, R(Z), and R(disrometer) Dec 3, 1999 Log(N)
Locations of Z Data used in the WSR-88D for Rain Measurement
Applications of Polarization • Polarimetric Variables • Measurements of Rain • Measurements of Snow • Classification of Precipitation
Polarimetric Variables • Quantitative - Zh, ZDR, KDP • Qualitative - |hv(0)|, , LDR, xv, hv • Are not independent • Are related to precipitation parameters • Relations among hydrometeor parameters allow retrieval of bulk precipitation properties and amounts
Rainfall Relation R(KDP, ZDR) R(KDP, ZDR) = 52 KDP0.96 ZDR-0.447 - is least sensitive to the variation of the median drop diameter Do - is valid for a 11 cm wavelength
R(gauges) Area Mean Rain Rate and BiasR(gauges)-R(radar) R(gauges)-R(Z) R(gauges)-R(KDPZDR)
Fundamental Problems in Remote Sensing of Precipitation • Classification - what is where? • Quantification - what is the amount?
Partitions in the Zh, ZDR Space into Regions of Hydrometeor Types
Scores for hydrometeor classes Ai= multiplicative factor 1 Wj = weighting function of two variables assigned to the class j Yi= a variable other than reflectivity (T, ZDR, KDP, hv, LDR) j = hydrometeor class, one the following: light rain, moderate rain, rain with large drops, rain/hail mixture, small hail, dry snow, wet snow, horizontal crystals, vertical crystals, other Class j for which Sj is a maximum is chosen as the correct one
Suggestions • Data quality - develop acceptance tests • Anomalous Propagation - consider “fuzzy logic” scheme • Classify precipitation into type (snow, hail, graupel, rain, bright band) even if only Z is available • Calibrate the radar (post operationally, use data, gauges, ..anything)
Specific Differential Phase at short wavelengths (3 and 5 cm) • Overcomes the effects of attenuation • Is more sensitive to rain rate • Is influenced by resonant scattering from large drops
Suggestions for Polarimetric measurements at =3 and 5 cm • Develop a classification scheme • Develop a R(KDP, ZDR) or other polarimetric relation to estimate rain • Correct Z for attenuation and ZDR for differential attenuation (use DP) • Use KDP to calibrate Z
Radar Echo Classifier • Uses “fuzzy logic” technique • Base data Z, V, W used • Derived fields (“features”) are calculated • Weighting functions are applied to the feature fields to create “interest” fields • Interest fields are weighted and summed • Threshold applied, producing final algorithm output
AP Detection Algorithm • Features derived from base data are: • Median radial velocity • Standard deviation of radial velocity • Median spectrum width • “Texture” of the reflectivity • Reflectivity variables “spin” and “sign” • Similar to texture • Computed over a local area
Clutter mean V Clutter texture Z Weather mean V Weather texture Z Investigate data “features” • Feature distributions • AP Clutter • Precipitation • Best features have good separation between echo types
AP Weighting Functions Median Radial Velocity Median Spectrum Width 1 1 “Texture” of Reflectivity Standard Deviation of Radial Velocity 0 0 “Reflectivity Spin” F) Spin 100 0 50 G) Sign “Reflectivity Sign” -10 -0.6 0 0.6 10
Field of Weights for AP Clutter AP Clutter AP Clutter For median velocity field, the weighting function is: 1 Interest Field Radial Velocity 0 Radial Velocity +3 m/s +3 m/s -2.3 0 2.3 Weighting functions are applied to the feature field to create an “interest” field Values scaled between 0-1
Reflectivity Radial Velocity Example of APDA using S-Pol data from STEPS Polarimetric truth field given by the Particle Identification (PID) output APDA is thresholded at 0.5 Good agreement between PID clutter and APDA PID APDA Clutter Rain 20 June 2000, 0234 UTC 0.5 degree elevation
Storm-Scale Prediction • Sample 4-hour forecast from the Center for Analysis and Prediction of Storms’ Advanced Regional Prediction System (ARPS) – a full-physics mesoscale prediction system • For the Fort Worth forecast • 4-hour prediction • 3 km grid resolution • Model initial state included assimilation of • WSR-88D reflectivity and radial velocity data • Surface and upper-air data • Satellite and wind profiler data
7 pm 8 pm 6 pm 4 hr 3 hr 2 hr Forecast w/Radar Radar
7 pm 8 pm 6 pm Radar 4 hr 3 hr 2 hr Fcst w/o Radar
R(Z) for Snow and Ice Water Content Snow fall rate: Z(mm6m-3) =75R2 ; R in mm h-1 of water Ice Water Content: IWC(gr m-3)= 0.446 (m)KDP(deg km-1)/(1-Zv/Zh)
Vertical Cross Sections Z ZDR KDP hv
In Situ and Pol Measurements T-28 aircraft