Motivation
340 likes | 430 Views
Motivation. “Nothing in biology makes sense except in the light of evolution” Christian Theodosius Dobzhansky. Conservation. Multiple sequence alignment (vWF). Rat QEPGGLVVPPTDAPVSSTTPYVEDTPEPPLHNFYCSK Rabbit QEPGGMVVPPTDAPVRSTTPYMEDTPEPPLHDFYWSN

Motivation
E N D
Presentation Transcript
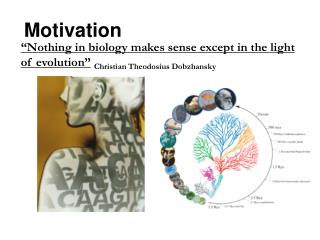
Motivation “Nothing in biology makes sense except in the light of evolution”Christian Theodosius Dobzhansky
Multiple sequence alignment (vWF) Rat QEPGGLVVPPTDAPVSSTTPYVEDTPEPPLHNFYCSK Rabbit QEPGGMVVPPTDAPVRSTTPYMEDTPEPPLHDFYWSN Gorilla QEPGGLVVPPTDAPVSPTTLYVEDISEPPLHDFYCSR Cat REPGGLVVPPTEGPVRATTPYVEDTPESTLHDFYCSR The problem: find for each position its conservation score.
Finding conserved regions from an alignment S1 KIFERCELARTDMKLGLDFYKGVSLANWVCLAKWESGYNs2KIFERCELARTLKRLGLDGYRGISLANWVCLAKWFWDYNs3KVFERCELARTLKRLGMDFYRGISLANWMCLAKWESGYNs4KTYERCEFARTLKRNGMSGYYGVSLADWVCLAQHESNYNs5KVFERCELARTLKKLGLDGYKGVSLANWLCLTKWESSYNs6KVFSKCELAHKLKAQEMDGFGGYSLANWVCMAEYESNFS Solution 1: assign a score of 1 if the position is fully conserved and a score of 0 if it is variable. Problem: this method is very “rough…”
Finding conserved regions from an alignment S1 KIFERCELARTDMKLGLDFYKGVSLANWVCLAKWESGYNs2KIFERCELARTLKRLGLDGYRGISLANWVCLAKWFWDYNs3KVFERCELARTLKRLGMDFYRGISLANWMCLAKWESGYNs4KTYERCEFARTLKRNGMSGYYGVSLADWVCLAQHESNYNs5KVFERCELARTLKKLGLDGYKGVSLANWLCLTKWESSYNs6KVFSKCELAHKLKAQEMDGFGGYSLANWVCMAEYESNFS Solution 2: count number of character states. Problem: this method does not take the evolutionary tree into account.
Evolutionary forces (e.g., mutation and selection) are the source of sequence variation S4 S6 S1 S5 S2 S3
A phylogenetic tree represents the history of evolution for the entire sequence. It is inferred based on all positions or from external data (e.g., fossils, other genes) S4 S6 S1 S5 S2 S3
Mapping changes onto the tree 3 K’s, 3 A’s and one replacement S1K K s2A A s3A A s4K A s5K K s6A K K K K A A S4(K) S6(A) S1(K) S5(K) S2(A) S3(A)
Mapping changes onto the tree 3 K’s, 3 A’s and 3 replacements S1K K s2A A s3A A s4K A s5K K s6A K K K K A A S4(A) S6(K) S1(K) S5(K) S2(A) S3(A)
Maximum Parsimony (MP) When the phylogenetic tree is known, for each position, the minimum number of changes needed to “explain” the data will be evaluated. The more changes -> the more variable the position
Mapping changes onto the tree Maximum parsimony score = 1 -> conserved. K S1K K s2A A s3A A s4K A s5K K s6A K K K A A S4(K) S6(A) S1(K) S5(K) S2(A) S3(A)
Mapping changes onto the tree Maximum parsimony score = 3 -> variable. K S1K K s2A A s3A A s4K A s5K K s6A K K K A A S4(A) S6(K) S1(K) S5(K) S2(A) S3(A)
S4 S6 S1 S5 S2 S3 What if the tree is not known… The score of each tree is the sum of scores over all positions. If the tree is not known, we choose the tree with the lowest score, the maximum parsimony tree. S1K K s2A A s3A A s4K A s5K K s6A K
Parsimony has many shortcomings. To name a few: • All changes are counted the same, which is not true for biological systems (Leu->Ile is much more likely than Leu-> His). • Cannot take biological context into account (secondary structures, dependencies among sites, evolutionary distances between the analyzed organisms, etc). • Statistical basis questionable.
Alternative: MAXIMUM-LIKELIHOOD METHOD.
Maximum likelihood uses a probabilistic model of evolution Each amino acid has a certain probability to change and this probability depends on the evolutionary distances. Evolutionary distances are inferred from the entire set of sequences.
Evolutionary distances Positions can be conserved because of two reasons. Either because of functional constraints, or because of short evolutionary time. 5 replacements in 10 positions between 2 chimps, is considered very variable. 5 replacements between human, and cucumber, is not considered that variable… Maximum likelihood takes this information into account.
The likelihood computations X t2 t1 Y t4 t3 Z t6 t5 K M A C With likelihood models we can: 1. Infer the phylogenetic tree 2. Compute conservation for each site
Maximum likelihood tree reconstruction This is incredibly difficult (and challenging) from the computational point of view, but efficient algorithms to find approximate solutions were developed.
Conserved site Slow evolving site Variable site Fast evolving site We estimate the rate of evolution for each site in the alignment Back to conservation: ‘rate of evolution’ Given a multiple sequence alignment (MSA), we define:
Evolutionary rates We model the rate by assuming that each site i in the sequence has a different rate, ri, relative to the average rate over all sites. A site of rate 2 evolves twice as fast as the average.
“conseq” (http://consurf.tau.ac.il/~consurf/conseq/html/form.html) Bcl-XL – a key regulator influencing the release of apoptosis promoting factors from mitochondria
“conseq” (http://consurf.tau.ac.il/~consurf/conseq/html/form.html)
Conseq was used to study 11 unstructured amino acids in the Capsid Domain (CA) of the Gag protein. The Capsid Domain of the Gag proteinmakes a major contribution to the assembly process of the virion particle. Melamed D., et al. J. Virol (2004) 78:9675:9688
Integrating the 3D information We map each color onto the 3D structure.
Integrating the 3D information: validation of the method (1) Do the results make sense for biologists?
Example: Bcl-XL protein (1bxl pdb ID) • Conservation pattern in the Bcl-XL protein, using alignment of 53 homologes from Protomap • Primary signal, Bak/ Bcl-XL interface. • Secondary signal, BH4 homology region; found only on Bcl-2 subfamily (BH4 may interact with CED-4).
The Structure of Human Src Tyrosine Kinase (Adapted from: Branden and Tooze, 1999)
SH2-SH3 interface MP results (233 SH2 homologues)
SH2-SH3 interface ML results (233 SH2 homologues)
Web-Server We developed a Web server applying this method. Using this server, one can enter a single PDB structure, and the server finds homologous sequences, produces the alignment and the tree, calculates the conservation scores, and visualizes the results on the 3D structure…


