Download
1 / 14
140 likes | 261 Views
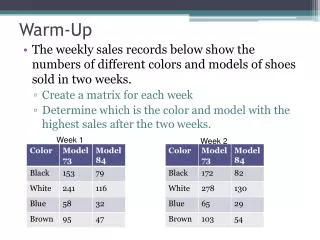
Warm-Up. The weekly sales records below show the numbers of different colors and models of shoes sold in two weeks. Create a matrix for each week Determine which is the color and model with the highest sales after the two weeks. Week 1. Week 2.

E N D
Warm-Up • The weekly sales records below show the numbers of different colors and models of shoes sold in two weeks. • Create a matrix for each week • Determine which is the color and model with the highest sales after the two weeks. Week 1 Week 2
Section 6.6: Stem and Leaf Diagrams and Mean, Median, Mode SWBAT calculate and mean, median, mode, and range. SWBAT construct and interpret stem and leaf diagrams
Measures of Central Tendency Add up all of the numbers and divide by the number of items. Use to describe middle when there are no outliers. Average List in order and find the middle item. If there are two in the middle, take the average. Use to describe middle when there are outliers. The middle value of a set of data List in order and find the item that repeats the most. (can be none, one, or multiple values) Use when data is nonnumeric or looking for most popular item The data item that occurs the most
Outliers • An outlier is a data value that is much greater or less than the other values in the set • Ex: Mrs. Ambs’ bowling score is an outlier
Measure of Dispersion A measure of dispersion describes how dispersed or spread out the values in a data set are. One measure of dispersion is a range
Range The difference between the largest and smallest values in the collection.
Given the table on College Enrollment and Tuition, calculate the mean, median, and mode enrollment. • Find the range of the enrollment and the tuition.
Example • Find the mean, median, mode, and range for the data set below: {-1, 2, 6, -2, -1, 0, 7, 9}
Example • Find the x value that fits the data below 95, 97, 98, 96, x; mean is 95.6
Stem and Leaf Diagram • A stem and leaf plot is an arrangement of digits that is used to display and order numerical data
Make a Steam and Leaf Diagram for the Length of Armspan that we collected earlier.
Your choice of place values for the stem and leaves will depend on the data. • Be sure to include a key that explains how to interpret the digits.
Make a stem and leaf plot of the following data points 100, 200, 250, 300, 310, 120


