
Monitoring Nitric Oxide Flux in Amazonian Rainforest Canopy
Explore the diurnal course of NO flux measured by eddy covariance and soil emissions in Amazonian rainforest canopy. Learn about the setup, measurements, analysis, and system specifications involved in this study.

Monitoring Nitric Oxide Flux in Amazonian Rainforest Canopy
E N D
Presentation Transcript
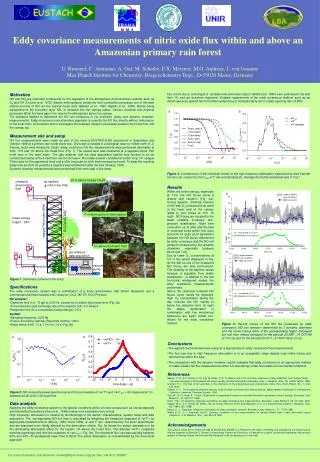
a a b b 20 m above canopy height ultrasonic anemometer 53m capillary inlet cone+ filter Figure 4: Diurnal course of the NO flux measured by eddy covariance, NO soil emission determined by 3 dynamic chambers and the ozone mixing ratios of the corresponding height. Displayed are half hour means averaged for the periode 23-SEP...01-OCT-99 at 11m (a) and for the periode 23-OCT...01-NOV-99 at 1m (b). 11 m above ground (stem space) mean canopy height ~ 33m opaque Teflon tube (65m) data transfer line 11m 1m above the forest floor gas analyzer ; data acquisition 1m vacuum pump a b Eddy covariance measurements of nitric oxide flux within and above an Amazonian primary rain forest U. Rummel, C. Ammann, A. Gut, M. Scheibe, F.X. Meixner, M.O. Andreae, J. von JouanneMax Planck Institute for Chemistry, Biogeochemistry Dept., D-55020 Mainz, Germany • Motivation • NO and NO2 are important compounds for the regulation of the atmospheric photochemical oxidants such as O3 and OH (Crutzen at al. 1979). Beside anthropogenic emissions from combustion processes one of the main natural sources of NO are the tropical forest soils (Bakwin et al., 1990; Kaplan et al., 1988). Before being transported to the boundary layer NO, is released into the canopy space. Various chemical and physical processes affect the trace gas on its way to the atmosphere above the canopy. • The standard method to determine the NO soil emissions is via enclosure (static and dynamic chamber) measurements. Eddy covariance is an alternative approach to quantify the NO flux directly without disturbance of the local micro environment and to investigate the turbulent transport processes between the forest floor and the canopy top. • Measurement site and setup • NO flux measurements were made as part of the second EUSTACH/LBA experiment in September and October 1999 at a primary rain forest tower site. The tower is located in a biological reserve 100km north of Ji- Parana, south west Amazonia, Brasil. Eddy covariance NO flux measurements were performed alternately at 53m, 11m and 1m above the forest floor (Fig. 1). The lowest level was measured at a separate tripod 15m north east of the main tower. The gas analyzer and the data acquisition system was housed in an air conditioned shelter at the forest floor next to the tower. The intake system consisted of a 65m long 1/4’’ opaque Teflon tube for the uppermost level and a 25m long tube for both lower measuring levels. To keep the resulting delay time as short as possible a capillary was installed 5m after the inlet (Delany, 1993). • Dynamic chamber measurements were performed 30m north east of the tower. • Figure 1: Schematic scheme of the setup • Specifications • The eddy covariance system was a combination of a sonic anemometer (Gill Solent Research) and a commercial chemiluminescence NO analyzer (CLD 780 TR, ECO Physics). • NO analyzer: • Detection limit (1): 70 ppt at 20.8 Hz, caused by a relative high noise level (Fig. 2a) • Time resolution (gas exchange rate of the reaction cell): 4.5 times/s • Response time (to a concentration step change): 0.5 s • System: • Sampling frequency: 20.8 Hz • Flow in the tubing: laminar (Reynolds number: 1091) • Delay times: 53m: 7.3 s; 11m,1m: 3.6 s (Fig. 2b) • Figure 2: NO composite powerspectrum (a) and Crosscorrelation of <w’T’> and <w’c’NO > (b) measured at 1m between 00:00 and 01:00 local time. • Data analysis • Applying the eddy covariance system to the special conditions within a forest canopy such as low windspeeds and intermittent turbulence (Gao et al., 1989) makes error evaluation very critical. • High frequency attenuation is caused by shortcomings in the sensor characteristics, system setup and data acquisition. The corresponding NO flux loss is calculated by weighting the measured cospectra of <w’T’> by appropriate transferfunctions (Moore, 1986; Horst 1999). w’ and T’ are determined by the sonic anemometer and are assumed to be hardly affected by the attenuation effects. Fig. 3a shows the sensor separation to be the dominating attenuation effect for the system 1m above the forest floor. The damped <w’T’> cospectra matches suprisingly well with the cospectra of <w’c’NO> (Fig. 3b). The maximum flux loss was typically between 20% and 30%. At windspeeds lower than 0.05ms-1 the actual attenuation is overestimated by the theoretical approach. Flux errors due to exchanges of sensible heat and water vapour (Webb et al. 1980) were estimated to be less then 1% and are therefore neglected. Violated requirements of the eddy covariance method, such as an inhomogeneous upwind fetch (modified understory) or nonstationarity led to a data rejecting ratio of 48%. Figure 3: Contributions of the individual effects to the high frequency attenuation expressed by their transfer function (a); cospectra of w’c’NO, w’T’ raw and damped (b). Average horizontal windspeed was 0.1ms-1. Results Within the forest canopy, especially at 11m, the NO fluxes show a distinct diel variation (Fig. 4a). During daytime, chemical reaction of NO with O3 (entrained from aloft) in the lower part of the canopy leads to zero fluxes at 11m. At night , NO fluxes are coupled to the weak unstable in-canopy tem-perature stratification. Night time convection up to 20m and the lack of chemical sinks within this layer accounts for quite good agreement between the NO fluxes determined by eddy covariance and the NO soil emission measured by the dynamic chambers especially between 22:00 and 7:00. Due to lower O3 concentrations at 1m in the period displayed in Fig. 4b the diel course of the measured NO fluxes are less pronounced. The reliability of the daytime values however is arguable. Very stable stratification in addition to the low horizontal windspeed makes the eddy covariance measurements problematic. Above the rainforest turbulent NO fluxes could hardly be detected. High O3 concentration during the day reduced the NO values to below the detection limit. At night the stable stratification in combination with low mechanical turbulence are again critical con-ditions for the eddy covariance method. • Conclusions • The applied chemiluminescence analyzer is appropriate for eddy covariance flux measurements. • The flux loss due to high frequency attenuation is in an acceptable range despite long intake tubing and laminar flow within the tube. • The comparison with the dynamic chamber results indicates that eddy covariance is an appropriate method to make reliable NO flux measurements within a forest canopy under favourable environmental conditions. • References • Bakwin, P. S., S. C. Wofsy, S. M. Fan, M. Keller, S. E. Trumbore, and J. M. da Costa, Emission of nitric oxide(NO) from tropical forest soils and exchange of NO between the forest canopy and the atmospheric boundary layer, J. Geophys. Res., 95, 16755-16764, 1990. • Crutzen, P.J., The role of NO and NO2 in the chemistry of the troposphere and stratosphere, Annu. Rev. Earth Planet. Sci., 7, 443- 472,1979. • Delany, A. C., Fast-response chemical sensors used for eddy correlation flux measurements, Measurement Challenges In Atmospheric Chemistry, American Chemical Society, 1993. • Gao, W., R. H. Shaw, K. T. Paw, Observation of organised structure in turbulent flow within and above a forest canopy, Boundary Layer Meteorol., 47, 349-377 1989. • Horst, T.W., On frequency response corrections for eddy covariance flux measurements, Boundary Layer Meteorol. 94, 517-520, 2000. • Kaplan, W.A., S. C. Wofsy, M. Keller, J.M. da Costa, Emission of NO and deposition of O3 in a tropical forest system, J. Geophys. Res., 93, 1389-1395, 1988. • Moore, C. J., Frequency response corrections for eddy correlation systems, Boundary Layer Meteorol., 37, 17-35,1986. • Webb, E. K., G. I. Pearman, and R. Leuning, Correction of flux measurements for density effects due to heat and water vapour transfer,Q. J. R. Meteorol. Soc., 106, 85-100,1980. • Acknowledgements • The authors would like to thank the staff at INCRA and IBAMA in Ji-Parana for the help in installing and maintaining the infrastructure. We are indebted to Beatrize E. Gomes (Universidade Federal de Rondonia, Ji Parana) for support concerning everything. We are also grateful to Wesley Saores da Silva and Nei Kavaguidi Leite for assisting us in the field. For more information: Udo Rummel, rummel@mpch-mainz.mpg.de, Fax: +49-6131-305487


