Box & Whisker Plot
Box & Whisker Plot. Chantal Alano, Trisha Jiang, Jordan Armstrong Period 1. What is a Box & Whisker Plot?. Used when there is a large amount of data Shows: Median(Q2) Minimum Maximum Lower Quartile(Q1) Upper Quartile(Q3) Sometimes outliers Inter Quartile Range (IQR).

Box & Whisker Plot
E N D
Presentation Transcript
Box & Whisker Plot Chantal Alano, Trisha Jiang, Jordan Armstrong Period 1
What is a Box & Whisker Plot? • Used when there is a large amount of data • Shows: • Median(Q2) • Minimum • Maximum • Lower Quartile(Q1) • Upper Quartile(Q3) • Sometimes outliers • Inter Quartile Range (IQR)
What is the Inter Quartile Range (IQR)? • Q3-Q1=IQR
Example • 7, 7, 9, 9, 10, 10, 11, 11, 12, 13 • Used to find number of sled dogs left competing in race
Data Necessary • Single Sets • Multiple Sets • Numerical
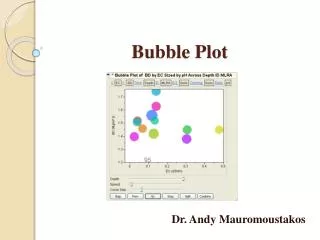
Real Life Data • Data was collected from Arcola’s 7th grade Honors Algebra class Hours of Electronics Used Per Day • 2.5, 4.5, 4.5, 1, 1.5, 1, 3, 2, 1, 6, 3, 2, 3, 1, 3, 5
Real Life Data (cont.) • Whatis the interquartile range (IQR) of this data set? Hours of Electronics Used Per Day Q1 = 1.25 Q3 = 3.75 Median = 2.75 Max. = 6 Min. = 1 Interquartile range: 3.75-1.25=2.5
How to Make a Box Plot Here is an example of a set of numbers collected. • 2.5, 4.5, 4.5, 1, 1.5, 1, 3, 2, 1, 6, 3, 2, 3, 1, 3, 5 • Order the numbers • 1, 1, 1, 1, 1.5, 2, 2, 2.5, 3, 3, 3, 3, 4.5, 4.5, 5, 6 • Find the median of the set • 1, 1, 1, 1, 1.5, 2, 2, 2.5, 3, 3, 3, 3, 4.5, 4.5, 5, 6 • Q2= (2.5 + 3)/2= 2.75
How to Make a Box Plot (cont.) • Find the medians of the upper and lower quartiles • 1, 1, 1, 1, 1.5, 2, 2, 2.5 and3, 3, 3, 3, 4.5, 4.5, 5, 6 • The median of the lower quartile is: • Q1 = (1 + 1.5)/2 = 1.25 • The median of the upper quartile is: • Q3 =(3 + 4.5)/2 = 3.75
How to Make a Box Plot (cont.) Hours of Electronic Used Per Day • Plot: • Median = 2.75 • Q1 = 1.25 • Q3 = 3.75 • Maximum = 6 • Minimum = 1 • Draw tick marks indicating median, Q1, Q3, minimum, and maximum • Draw box around median, Q1, and Q3 • Connect box to maximum and minimum endpoints to create “whiskers”
Advantages & Disadvantages Advantages Disadvantages Doesn’t show specific numbers Doesn’t show subtle changes Can’t identify the original numbers used in the data set • Able to tell median, range, lower quartile, upper quartile, minimum, and maximum • Not cluttered with too much information • Can show outliers
Research Page/ Work Cited • http://www.ck12.org/user:amhhdGVydEB5c3NjaG9vbHMub3Jn/section/Box-and-Whisker-Plots/ • http://www.purplemath.com/modules/boxwhisk.htm • http://www.vertex42.com/ExcelTemplates/box-whisker-plot.html • http://www.edu.gov.mb.ca/k12/tech/lict/let_me_try/g6/mh132.html
Special Thanks To… • Jordan Armstrong • Chantal Alano • Trisha Jiang • Mrs. Ellwood • Honors Algebra Class