Analyzing Bivariate Data with Scatterplots and Correlations
200 likes | 218 Views
Explore how increasing ginkgo biloba amounts affect memory abilities in students using scatterplots and correlations. Learn to measure relationships, create scatterplots, and interpret results in this informative study.

Analyzing Bivariate Data with Scatterplots and Correlations
E N D
Presentation Transcript
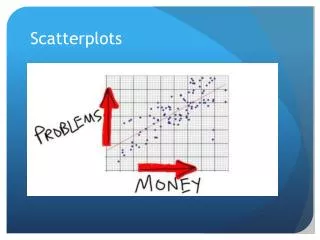
Scatterplots • Describing relationship on bivariate data
Explanatory variables • A researcher wants to know if taking increasing amounts of ginkgo biloba will result in increased capacities of memory ability for different students. He administers it to the students in doses of 250 milligrams, 500 milligrams, and 1000 milligrams. What is the explanatory variable in this study? • Amount of ginkgo biloba given to each student. • Change in memory ability. • Size of the student’s brain. • Whether the student takes the ginkgo biloba.
Explanatory variables (answer) • A researcher wants to know if taking increasing amounts of ginkgo biloba will result in increased capacities of memory ability for different students. He administers it to the students in doses of 250 milligrams, 500 milligrams, and 1000 milligrams. What is the explanatory variable in this study? • Amount of ginkgo biloba given to each student. • Change in memory ability. • Size of the student’s brain. • Whether the student takes the ginkgo biloba.
Numeric bivariate data • The first step in analyzing numeric bivariate data is to • Measure strength of linear relationship. • Create a scatterplot. • Model linear relationship with regression line.
Numeric bivariate data (answer) • The first step in analyzing numeric bivariate data is to • Measure strength of linear relationship. • Create a scatterplot. • Model linear relationship with regression line.
Scatterplots • Look at the following scatterplot. Choose which description BEST fits the plot. • Direction: positive, form: linear, strength: strong • Direction: negative, form: linear, strength: strong • Direction: positive, form: non-linear, strength: weak • Direction: negative, form: non-linear, strength: weak • No relationship
Scatterplots (answer) • Look at the following scatterplot. Choose which description BEST fits the plot. • Direction: positive, form: linear, strength: strong • Direction: negative, form: linear, strength: strong • Direction: positive, form: non-linear, strength: weak • Direction: negative, form: non-linear, strength: weak • No relationship
Scatterplots • Look at the following scatterplot. Choose which description BEST fits the plot. • Direction: positive, form: non-linear, strength: strong • Direction: negative, form: linear, strength: strong • Direction: positive, form: linear, strength: weak • Direction: positive, form: non-linear, strength: weak • No relationship
Scatterplots (answer) • Look at the following scatterplot. Choose which description BEST fits the plot. • Direction: positive, form: non-linear, strength: strong • Direction: negative, form: linear, strength: strong • Direction: positive, form: linear, strength: weak • Direction: positive, form: non-linear, strength: weak • No relationship
Scatterplots • Which of the following scatterplots displays the stronger linear relationship? • Plot A • Plot B • Same for both
Scatterplots (answer) • Which of the following scatterplots displays the stronger linear relationship? • Plot A • Plot B • Same for both
Scatterplots • Look at the following scatterplot. Which variable is categorical? • Height • Weight • Gender
Scatterplots (answer) • Look at the following scatterplot. Which variable is categorical? • Height • Weight • Gender
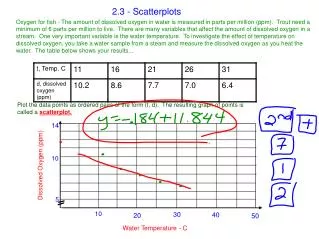
1. SCALE THE HORIZONTAL AND VERTICAL AXES. INTERVAL MUST BE UNIFORM (DISTANCE OF THE TICK MARKS). IF THE SCALE DOES NOT BEGIN AT ZERO, INDICATE A BREAK ON YOUR PLOT. 2. LABEL BOTH AXES 3. IF YOU ARE GIVEN A GRID, TRY TO ADOPT A SCALE SO THAT YOUR PLOT USES THE WHOLE GRID. DON’T COMPRESS THE PLOT INTO ONE CORNER OF THE GRID. tips for drawing scatterplots
“r” ranges from −1 to +1 “r” quantifies the strength and direction of a linear relationship between two quantitative variables. Strength: How closely the points follow a straight line. Direction is positive when individuals with higher x values tend to have higher values of y.
TO ADD CATEGORICAL VARIABLE TO A SCATTERPLOT, USE A DIFFERENT COLOR OR SYMBOL FOR EACH CATEGORY. Categorical Variables in Scatterplots