Download
1 / 20
230 likes | 415 Views
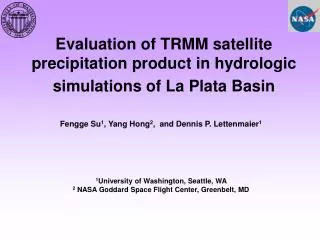
Evaluation of TRMM Precipitation Radar for Estimates of Surface Rainfall Rate. Liang Liao Goddard Earth Sciences & Technology Research Morgan State University Greenbelt, MD 20771 Robert Meneghini NASA/Goddard Space Flight Center Greenbelt, MD 20771. Objectives.

E N D
Evaluation of TRMM Precipitation Radar for Estimates of Surface Rainfall Rate Liang Liao Goddard Earth Sciences & Technology Research Morgan State University Greenbelt, MD 20771 Robert Meneghini NASA/Goddard Space Flight Center Greenbelt, MD 20771
Objectives • Validating TRMM PR Measurements • Compare with the well-calibrated non-attenuated ground-based radar measurements. • Examining TRMM PR Algorithms • Rain attenuation correction • Rain rate estimation • Version-7 vs. Version-6 Vancouver IGARSS 2011
Earth Coordinate System Schematic diagram of the earth coordinate system in which the latitude, , and longitude, , are defined.
Geometry for correction of PR offsets (x and y) in x and y axes at a height of h.
Radar Reflectivity (3/9/1998) h = 1.5 km h = 3 km
Area-Averaged Rain TRMM PR WSR-88D
Scatter Plots of Mean Reflectivity (2008-2009) PR (v7) vs. WSR-88D at a height of 3.0 km in MELB PR (v6) vs. WSR-88D at a height of 3.0 km in MELB
Scatter Plots of Mean Rain (2008-2009) PR (v7) vs. WSR-88D in MELB PR (v6) vs. WSR-88D in MELB
Summary • Comparisons of the PR-derived reflectivities and rain rates with the same quantities derived from near-simultaneous measurements by the WSR-88D ground-based Melbourne radar are presented for more than 230 overpasses during 1998-2007. • The reflectivity fields derived from the PR data after attenuation correction, and the conditional mean and area-averaged rain rates from the PR agree well with those obtained from the WSR-88D. • Improvement of rain estimates is found from PR version-6 to version-7 standard products. • Further comparisons will be conducted in the future as more data become available and these procedures will be extended to the other climatological sites. Vancouver IGARSS 2011