Download
1 / 37
370 likes | 382 Views
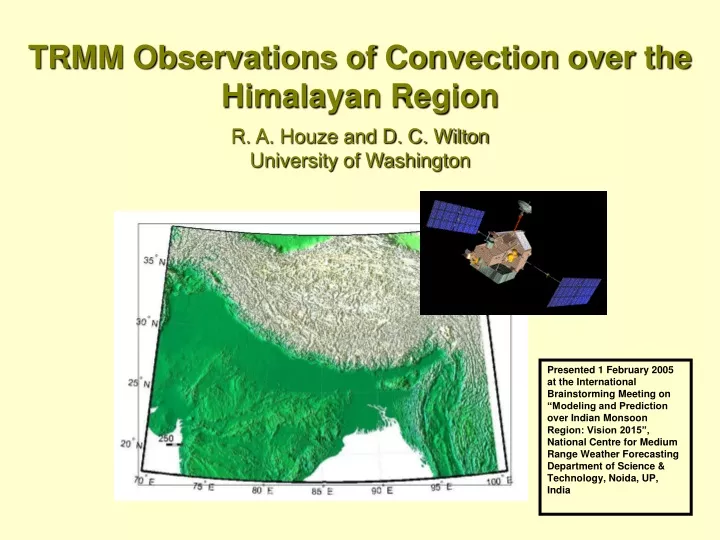
TRMM Observations of Convection over the Himalayan Region R. A. Houze and D. C. Wilton University of Washington.

E N D
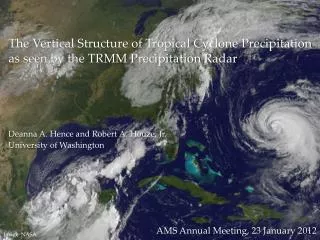
TRMM Observations of Convection over the Himalayan RegionR. A. Houze and D. C. WiltonUniversity of Washington Presented 1 February 2005 at the International Brainstorming Meeting on “Modeling and Prediction over Indian Monsoon Region: Vision 2015”, National Centre for Medium Range Weather Forecasting Department of Science & Technology, Noida, UP, India
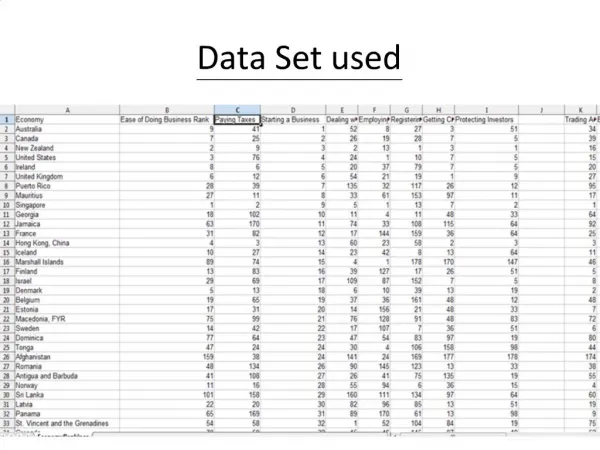
TRMM Precipitation Radar Data Set Used in This Study • June-September 2002, 2003 • 1648 Overpasses over Himalayan region • Data specially processed at University of Washington • Cartesianized to facilitate analysis in “Mountain Zebra” • This data set optimized to analyze vertical structure of echoes
TRMM Satellite Instrumentation l = 2 mm Important! PR measures 3D structure of radar echoes Kummerow et al, 1998
Idealized Horizontal Pattern of the Radar Echo Pattern in a Mesoscale Convective System Radar reflectivity Echo type Plan View Houze 1997
Conceptual Model of Vertical Structure “Convective” Rain Elements Houze 1997
Conceptual Model of Vertical Structure “Stratiform ” Rain Elements Houze 1997
To study the vertical structure of convective regions we define 3D echo “cores” • The TRMM Precipitation Radar data are provided in “bins” ~5 km in the horizontal and ~0.25 km in the vertical • Echo cores are formed by contiguous bins (in 3D space) of reflectivity values which exceed the threshold of 40 dBZ. 3D radar echo bounded by 40 dBZ contour echocore land
“Deep Convection” Core: 14 June 2002, 0859 UTC “deep convection” cores are those for which the maximum height of the 40 dBZ core are greater than 10 km 4 km level 30N 16 Height (km) 8 28N 0 55 110 Distance (km) 74E 76E
Analysis Subregions WesternSubregion Central Subregion Eastern Subregion °N Arabian Sea Bay of Bengal INDIA °E
Normalized Frequency Distribution of 40 dBZConvective Echo Core Heights In western region--graupel particles lofted to great heights by strong updrafts
Lightning Frequency Based on TRMM Satellite Observations Barros et al. 2004
“Wide Convection” Core: 22 July 2002, 13:09 UTC “wide convection” cores are those for which the area of the 40 dBZ core are greater than 1,000 km2, corresponding to a dimension of approximately 30km 4 km level 34N 16 30N Height (km) 8 72E 76E 0 120 240 Distance (km)
In western region—wide convective areas more frequent Cumulative Distribution of Convective Core Breadth
Analysis of stratiform echo regions • Used TRMM algorithm for separating echoes into stratiform & convective regions • Two criteria: Existence of bright band Lack of intense echo cores
4.5 km level Echo Classified as Stratiform 4.5 km level Cross Section 28N 30N 30N 16 Height (km) 24N 8 0 288 576 22N 22N Distance (km) 94E 98E 92E 100E 92E 100E “Broad Stratiform” Case: 5 June 2003, 13:47 UTC “broad stratiform” cases are those for which the area classified by the TRMM algorithm as stratiform precipitation is greater than about 50,000 km2, corresponding to a dimension of approximately 225 km
Cumulative Distribution Functionfor Stratiform Precipitation Areas
TRMM Satellite Instrumentation l = 2 cm Important! PR measures 3D structure of radar echoes Kummerow et al, 1998
All data 1648 overpasses Relative frequency of occurrence Contoured Frequency by Altitude Diagram
Reflectivity Statistics by Sub-Region, Rain-Type, & Altitude Convective • Convection is stronger & deeper in west • Statiform more pronounced in east Stratiform
Terrain Elevation Categories °N Mountain Lowland Foothill °E Lowland 0-300 m, Foothills 300-3000 m, Mountain >3000 km
Reflectivity Statistics by Subtending Terrain Lowland Foothills Convection is slightly deeper & stronger over the lowlands than the foothills Mountain
Locations of Intense Convective Cases and Wide Stratiform Cases Intense Convective Wide Stratiform Concavities lead to concentration of intense convection in NW and stratiform systems in NE °N °E
Conclusions • 2 years of TRMM PR data have been processed for analysis of vertical structure of convection over the Himalayan region • 40 dBZ cores deepest & broadest over NW region • 40 dBZ cores in NW region can reach 17+ km—indicating graupel lofted to high levels by strong updrafts • Intense convection occurs primarily over lowlands and foothills • Intense convection is concentrated in the NW concavity of the Himalayas—continental regime • Stratiform areas larger & more frequent over NE, concentrated in the NE concavity—indicating a more maritime convective regime.
Thunderstorm over India “low echo centroid” (coalescence & riming) Maheshwari & Mathur 1968
Colorado Rockies Big Thompson Storm 1976 “low echo centroid” Caracena et al. 1979
All data 1648 overpasses Relative frequency of occurrence Contoured Frequency by Altitude Diagram
Wide Area of Convection Case: 1309 UTC 22 July 200200 UTC Soundings
Wide Area of Convection Case: 1309 UTC 22 July 200212 UTC Soundings
Broad Stratiform Case: 13:47 UTC5 June 2003 12 UTC Soundings
20-year Alpine Autumn Precipitation Climatology(rain gauge analysis by Frei and Schaer 1998)