Download
1 / 1
20 likes | 122 Views
Because interactions between the modeled changes affect the chemical production and loss of ozone, there are nonlinearities in the chemistry of the combined chemical run such that the combined run does not equal the sum.

E N D
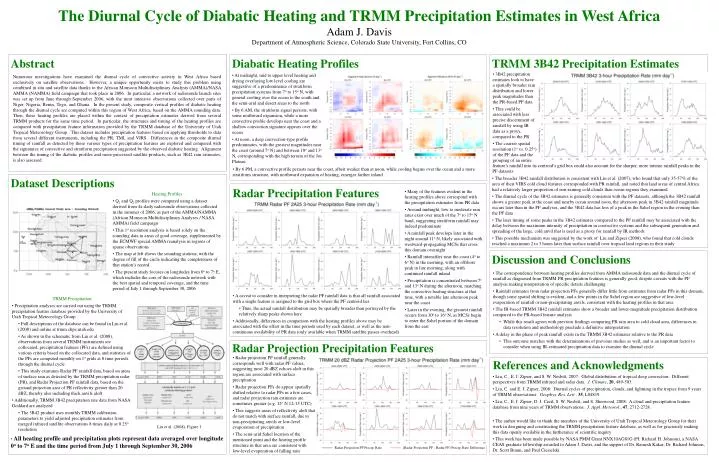
Because interactions between the modeled changes affect the chemical production and loss of ozone, there are nonlinearities in the chemistry of the combined chemical run such that the combined run does not equal the sum. The Diurnal Cycle of Diabatic Heating and TRMM Precipitation Estimates in West Africa Adam J. Davis Department of Atmospheric Science, Colorado State University, Fort Collins, CO Diabatic Heating Profiles TRMM 3B42 Precipitation Estimates Abstract • 3B42 precipitation estimates look to have a spatially broader rain distribution and lower peak magnitudes than the PR-based PF data • This could be associated with less precise discernment of rainfall by using IR data as a proxy, compared to the PR • The coarser spatial resolution (1o vs. 0.25o) of the PF data and the grouping of an entire • At midnight, mid to upper level heating and drying overlaying low level cooling are suggestive of a predominance of stratiform precipitation systems from 7o to 15o N, with general cooling over the ocean to the south and the semi-arid and desert areas to the north • By 6 AM, the stratiform signal persists, with some northward expansion, while a more convective profile develops near the coast and a shallow convection signature appears over the ocean • At noon, a deep convection-type profile predominates, with the greatest magnitudes near the coast (around 7o N) and between 10o and 13o N, corresponding with the high terrain of the Jos Plateau Numerous investigations have examined the diurnal cycle of convective activity in West Africa based exclusively on satellite observations. However, a unique opportunity exists to study this problem using combined in situ and satellite data thanks to the African Monsoon Multidisciplinary Analysis (AMMA)/NASA AMMA (NAMMA) field campaign that took place in 2006. In particular, a network of radiosonde launch sites was set up from June through September 2006, with the most intensive observations collected over parts of Niger, Nigeria, Benin, Togo, and Ghana. In the present study, composite vertical profiles of diabatic heating through the diurnal cycle are computed within this region of West Africa, based on the AMMA sounding data. Then, these heating profiles are placed within the context of precipitation estimates derived from several TRMM products for the same time period. In particular, the structures and timing of the heating profiles are compared with precipitation feature information provided by the TRMM database of the University of Utah Tropical Meteorology Group. This dataset includes precipitation features based on applying thresholds to data from several different instruments, including the PR, TMI, and VIRS. Differences in the composite diurnal timing of rainfall as detected by these various types of precipitation features are explored and compared with the signatures of convective and stratiform precipitation suggested by the observed diabatic heating. Alignment between the timing of the diabatic profiles and more-processed satellite products, such as 3B42 rain estimates, is also assessed. feature’s rainfall into its centroid’s grid box could also account for the sharper, more intense rainfall peaks in the PF datasets • By 6 PM, a convective profile persists near the coast, albeit weaker than at noon, while cooling begins over the ocean and a more stratiform structure, with northward expansion of heating, emerges farther inland • The broader 3B42 rainfall distribution is consistent with Liu et al. (2007), who found that only 35-57% of the area of their VIRS cold cloud features corresponded with PR rainfall, and noted that land areas of central Africa had a relatively larger proportion of non-raining cold clouds than ocean regions they examined • The diurnal cycle of the 3B42 estimates is generally consistent with the PF datasets, although the 3B42 rainfall shows a greater peak at the coast and nearby ocean around noon, the afternoon peak in 3B42 rainfall magnitude occurs later than in the PF analyses, and the 3B42 data has less of a peak in the Sahel region in the evening than the PF data • The later timing of some peaks in the 3B42 estimates compared to the PF rainfall may be associated with the delay between the maximum intensity of precipitation in convective systems and the subsequent generation and spreading of the large, cold anvil that is used as a proxy for rainfall by IR methods • This possible mechanism was suggested by the work of Liu and Zipser (2008), who found that cold clouds reached a maximum 2 to 3 hours later than surface rainfall over tropical land regions in their study Dataset Descriptions Radar Precipitation Features • Many of the features evident in the heating profiles above correspond with the precipitation estimates from PR data • Around midnight, low to moderate rain rates exist over much of the 7o to 15o N band, suggesting stratiform rainfall may indeed predominate • A rainfall peak develops later in the night around 11o N, likely associated with westward-propagating MCSs that cross this domain overnight • Rainfall intensifies near the coast (4o to 6o N) in the morning, with an offshore peak in late morning, along with continued rainfall inland • Precipitation is concentrated between 7o and 13o N during the afternoon, matching the convective heating structure at that time, with a notable late afternoon peak near the coast • Later in the evening, the greatest rainfall occurs from 10o to 16o N, as MCSs begin to enter the Sahel portion of the domain from the east • Heating Profiles • Q1 and Q2 profiles were computed using a dataset derived from 4x-daily radiosonde observations collected in the summer of 2006, as part of the AMMA/NAMMA (African Monsoon Multidisciplinary Analyses / NASA AMMA) field campaign • This 1oresolution analysis is based solely on the sounding data in areas of good coverage, supplemented by the ECMWF special AMMA reanalysis in regions of sparse observations • The map at left shows the sounding stations, with the degree of fill of the circle indicating the completeness of that station’s record • The present study focuses on longitudes from 0o to 7o E, which includes the core of the radiosonde network with the best spatial and temporal coverage, and the time period of July 1 through September 30, 2006 Discussion and Conclusions • The correspondence between heating profiles derived from AMMA radiosonde data and the diurnal cycle of rainfall as diagnosed from TRMM PR precipitation features is generally good, despite caveats with the PF analysis making interpretation of specific details challenging • Rainfall estimates from radar projection PFs generally differ little from estimates from radar PFs in this domain, though some spatial shifting is evident, and a few points in the Sahel region are suggestive of low-level evaporation of rainfall or non-precipitating anvils, consistent with the heating profiles in that area • The IR-based TRMM 3B42 rainfall estimates show a broader and lower-magnitude precipitation distribution compared to the PR-based feature analysis • While this result agrees with previous findings comparing PR rain area to cold cloud area, differences in data resolution and methodology preclude a definitive interpretation • A delay in the phase of peak rainfall exists in the TRMM 3B42 estimates relative to the PR data • This outcome matches with the determinations of previous studies as well, and is an important factor to consider when using IR-estimated precipitation data to examine the diurnal cycle • A caveat to consider in interpreting the radar PF rainfall data is that all rainfall associated with a single feature is assigned to the grid box where the PF centroid lies • Thus, the actual rainfall distribution may be spatially broader than portrayed by the relatively sharp peaks shown here • Additionally, differences in comparison with the heating profiles above may be associated with the offset in the time periods used by each dataset, as well as the non-continuous availability of PR data (only available when TRMM satellite passes overhead) • TRMM Precipitation • Precipitation analyses are carried out using the TRMM precipitation feature database provided by the University of Utah Tropical Meteorology Group • Full descriptions of the database can be found in Liu et al. (2008) and online at trmm.chpc.utah.edu • As shown in the schematic from Liu et al. (2008), observations from several TRMM instruments are collocated, precipitation features (PFs) are defined using various criteria based on the collocated data, and statistics of the PFs are computed monthly on 1o grids at 8 time periods through the diurnal cycle • This study examines Radar PF rainfall data, based on areas of surface rain as detected by the TRMM precipitation radar (PR), and Radar Projection PF rainfall data, based on the ground projection area of PR reflectivity greater than 20 dBZ, thereby also including thick anvils aloft • Additionally, TRMM 3B42 precipitation rate data from NASA Goddard are analyzed • The 3B42 product uses monthly TRMM calibration parameters to yield adjusted precipitation estimates from merged infrared satellite observations 8 times daily at 0.25o resolution Radar Projection Precipitation Features • Radar projection PF rainfall generally corresponds well with radar PF values, suggesting most 20 dBZ echoes aloft in this region are associated with surface precipitation • Radar projection PFs do appear spatially shifted relative to radar PFs in a few cases, and radar projection rain estimates are sometimes greater (e.g. 12o N 12-15 UTC) • This suggests areas of reflectivity aloft that do not match with surface rainfall, due to non-precipitating anvils or low-level evaporation of precipitation • The semi-arid Sahel location of the mentioned point and the heating profile structure in that area are consistent with low-level evaporation of falling rain References and Acknowledgments • Liu, C., E. J. Zipser, and S. W. Nesbitt, 2007: Global distribution of tropical deep convection: Different perspectives from TRMM infrared and radar data. J. Climate, 20, 489-503. • Liu, C. and E. J. Zipser, 2008: Diurnal cycles of precipitation, clouds, and lightning in the tropics from 9 years of TRMM observations. Geophys. Res. Lett., 35, L04819. • Liu, C., E. J. Zipser, D. J. Cecil, S. W. Nesbitt, and S. Sherwood, 2008: A cloud and precipitation feature database from nine years of TRMM observations. J. Appl. Meteorol., 47, 2712-2728. • The author would like to thank the members of the University of Utah Tropical Meteorology Group for their work in designing and constructing the TRMM precipitation feature database, as well as for graciously making this data openly available in the furtherance of scientific inquiry • This work has been made possible by NASA PMM Grant NNX10AG81G (PI: Richard H. Johnson), a NASA CEAS graduate fellowship awarded to Adam J. Davis, and the support of Dr. Ramesh Kakar, Dr. Richard Johnson, Dr. Scott Braun, and Paul Ciesielski. Liu et al. (2008), Figure 1 • All heating profile and precipitation plots represent data averaged over longitude 0o to 7o E and the time period from July 1 through September 30, 2006 Radar Projection PF Precip. Rate (Radar Projection PF - Radar PF) Precip. Rate Difference Spatial RVOC: Present Day and Future Climate