Download
1 / 6
60 likes | 182 Views
Dense Gauge Network Confirms Improvement in TRMM Radar Rainfall Intensity Estimates Eyal Amitai , Code 612, NASA GSFC and Chapman University.

E N D
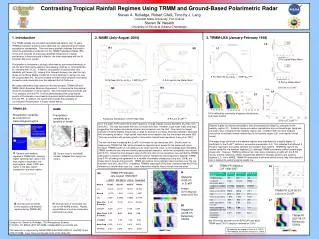
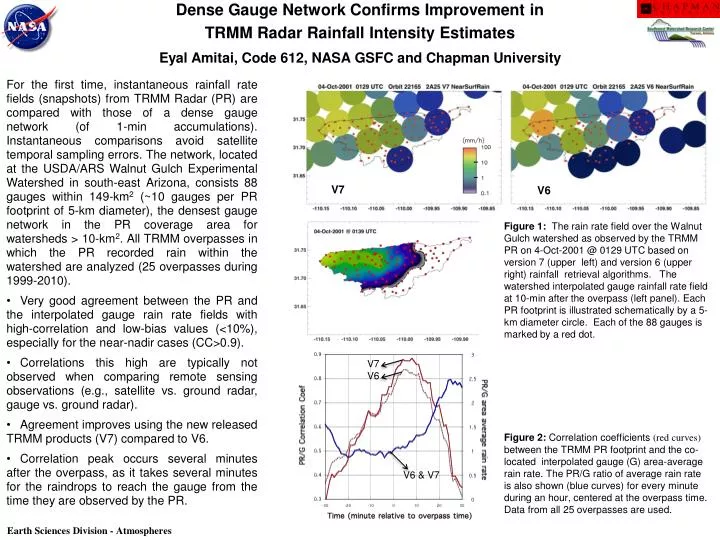
Dense Gauge Network Confirms Improvement in TRMM Radar Rainfall Intensity Estimates EyalAmitai, Code 612, NASA GSFC and Chapman University • For the first time, instantaneous rainfall rate fields (snapshots) from TRMM Radar (PR) are compared with those of a dense gauge network (of 1-min accumulations). Instantaneous comparisons avoid satellite temporal sampling errors. The network, located at the USDA/ARS Walnut Gulch Experimental Watershed in south-east Arizona, consists 88 gauges within 149-km2 (~10 gauges per PR footprint of 5-km diameter), the densest gauge network in the PR coverage area for watersheds > 10-km2. All TRMM overpasses in which the PR recorded rain within the watershed are analyzed (25 overpasses during 1999-2010). • Very good agreement between the PR and the interpolated gauge rain rate fields with high-correlation and low-bias values (<10%), especially for the near-nadir cases (CC>0.9). • Correlations this high are typically not observed when comparing remote sensing observations (e.g., satellite vs. ground radar, gauge vs. ground radar). • Agreement improves using the new released TRMM products (V7) compared to V6. • Correlation peak occurs several minutes after the overpass, as it takes several minutes for the raindrops to reach the gauge from the time they are observed by the PR. V7 V6 Figure 1:The rain rate field over the Walnut Gulch watershed as observed by the TRMM PR on 4-Oct-2001 @ 0129 UTC based on version 7 (upper left) and version 6 (upper right) rainfall retrieval algorithms. The watershed interpolated gauge rainfall rate field at 10-min after the overpass (left panel). Each PR footprint is illustrated schematically by a 5-km diameter circle. Each of the 88 gauges is marked by a red dot. V7 V6 Figure 2:Correlation coefficients (red curves) between the TRMM PR footprint and the co-located interpolated gauge (G) area-average rain rate. The PR/G ratio of average rain rate is also shown (blue curves) for every minute during an hour, centered at the overpass time. Data from all 25 overpasses are used. V6 & V7 Earth Sciences Division - Atmospheres
Name: Eyal Amitai, NASA GSFC, Code 612, and Chapman University E-mail: Eyal.Amitai@nasa.gov Phone: 301-614-6341 Collaborators: David C. Goodrich (USDA-ARS), Carl L. Unkrich (USDA-ARS), EmadHabib (University of Louisiana at Lafayette), and Bryson Thill (Chapman University) References: Amitai E., C. Unkrich, D. Goodrich, E. Habib, and B. Thill, 2011: Assessing satellite-based rainfall estimates in semi-arid watersheds using the Walnut Gulch gauge network and TRMM-PR. 35th AMS Conference on Radar Meteorology, September 26-30, Pittsburgh, Pennsylvania (and J. Hydrometeorology – in review). http://ams.confex.com/ams/35Radar/webprogram/Paper191886.html Data Sources: TRMM Precipitation Radar, USDA/ARS Walnut Gulch Experimental Watershed gauge data. Technical Description of Figures: Figure 1:An example of a TRMM overpass in which the PR recorded rain within the Walnut Gulch watershed. The interpolated gauge rainfall rate fields are available at 100-m pixel resolution every single minute. The figure presents the interpolated field at 10-min after the overpass, when the correlation with the spaceborne radar estimates is at maxima as it takes several minutes for the raindrops to reach the gauge from the time they are observed by the PR. In all three fields, the highest intensities are observed at the west side of the watershed near the outlet. The correlation with the gauge field improves as we switch from V6 to V7. This is indicated by the orange color that has changed to green, and by several footprints with weak intensities (blue, V6) in the southeast region of the watershed that became dry (no color in V7) - all fields have the same color scale. Figure 2: Very high correlation between the PR and the interpolated gauge rain rate field is achieved several minutes after the overpass time. Higher values are obtained with the new released products V7. Values this high are typically not observed when comparisons are performed against ground radar estimates (e.g., satellite vs. ground radar, gauge vs. ground radar). During the time of maximum correlation, the satellite overestimates the rain by less than 10%. We do expect some overestimation, as raindrops are subject to evaporation and wind-induced gauge under-catch in this semi-arid environment. Scientific significance: Studying changes in water cycle, global circulation, and water resources depends upon our ability to measure precipitation from space. Precipitation forecasting accuracy and many hydrological applications depend on the accuracy of precipitation estimates. The evaluation of rainfall rate estimates from low-orbital satellites observations, like TRMM and GPM, requires in-situ measurements. Direct comparisons with in-situ measurements (e.g., rain gauges) have been limited to rainfall accumulations. Such comparisons are associated with large uncertainties due to satellite temporal sampling errors. Comparisons of instantaneous rain rate fields (snapshots) from satellite and gauge observations have been avoided, as they are associated with large uncertainties due to volume sampling discrepancies. However, the configuration of the gauge network in the Walnut Gulch Experimental Watershed and its high degree of temporal synchronization justify such comparisons. Relevance for future science and relationship to Decadal Survey: Future science flight GPM will require accurate reference products for validation, and therefore, will benefit from this effort, which is the first study comparing and assessing snapshots of high-resolution satellite precipitation intensity estimates with in-situ measurements. Earth Sciences Division - Atmospheres
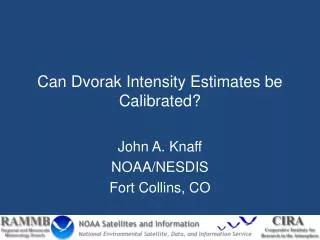
Mount Etna Plume Height and Eruption Style from MISR Scollo, S., R.A. Kahn, D.L. Nelson, M. Coltelli, D.J. Diner, M.J. Garay, and V.J. Realmuto. MISR observations of Etna volcanic plumes. J. Geophys. Res. 2012, in press. Mount Etna Fig. 1. MISR stereo heights for the ash-dominated plume on 30 December 2002 Fig. 3. MISR stereo heights for the sulfate/water-dominated plume on 25 Nov. 2006 Fig. 2. 29 Sept. 2006 – MISR retrieved small spherical particles, indicating a sulfate/water-dominated plume The strength of volcanic eruptions is related to the fraction of volcanic ash in the plume, compared to water and sulfate particles. The elevation of the plume above the surface is also an indication of strength, as well as a key factor in predicting how long the particles will reside in the atmosphere, how far they will travel, and the magnitude of their environmental impact. Data from the NASA Earth Observing System’s Multi-angle Imaging SpectroRadiometer (MISR) can monitor both these quantities, globally. Plume injection height is derived from MISR stereo observations, and in this study, is applied to Mount Etna eruptions for six years between 2000 and 2008, and tested against ground-based triangulations. The two-dimensional maps of height produced from MISR observations compare well in the tests, and provide much more extensive plume height information than is available from any other source. The new and most important contribution of Scollo et al. (2012) is a demonstration of MISR’s ability to distinguish volcanic plumes dominated by ash from those dominated by sulfate and water particles. Volcanic ash is identified in the MISR aerosol retrievals as large, non-spherical, somewhat dark particles, whereas sulfate and water particles are small-medium, spherical, non-absorbing particles. For the nine cases during the study period for which coincident MISR and ground-based observations of Etna plume particle properties were made, MISR correctly identified the plume eruptive style based on particle type. Earth Sciences Division - Atmospheres
Name: Ralph Kahn, NASA GSFC, Code 613E-mail: ralph.kahn@nasa.govPhone: 301-614-6193 References: Scollo, S., R.A. Kahn, D.L. Nelson, M. Coltelli, D.J. Diner, M.J. Garay, and V.J. Realmuto, 2012. MISR observations of Etna volcanic plumes. J. Geophys. Res., in press. Kahn, R.A., J.A. Limbacher, B.J. Gaitley, and M.J. Garay, 2012. Eyjafjalljökull Volcano Ash Plume Particle Type Characterization from Space-Based Multi-angle Imaging. Atmosph. Chem. Phys., in preparation. Data Sources: Terra/MISR, MODIS, and ground-based observations Technical Description of Figures: Figure 1:MISR nadir-viewing, true-color image showing Etna, with stereo-derived plume height superposed, for the ash-dominated plume on 30 December 2002. Stereo heights are reported at 1.1 km horizontal resolution, with better than 0.5 km vertical resolution, obtained from the MISR Interactive Explorer (MINX) software, which also derives and applies a wind correction. This plume was injected more than 6 km above the geoid. Particle effective size and shape, as well as aerosol optical depth, were derived at 17.6 km horizontal resolution from the MISR Standard aerosol retrieval algorithm, version 22. Large, non-spherical particles derived here indicate an ash-dominated plume, a result confirmed by ground-based observations. Figure 2: Ground-based image of the Etna plume on 29 September 2006. MISR retrievals identified small spherical particles, indicating a sulfate/water-dominated plume. Figure 3: MISR nadir-viewing, true-color image showing Etna, with stereo-derived plume height superposed, for the sulfate/water-dominated plume on 25 November 2006. Scientific significance: The strength of volcanic eruptions is related to the fraction of volcanic ash in the plume, compared to water and sulfate particles. The most important contribution of Scollo et al. (2012) is a demonstration of MISR’s ability to distinguish volcanic plumes dominated by ash from those dominated by sulfate and water particles. Plume height is also an indicator of eruptive strength, and in addition, is a critical input for modeling plume evolution and environmental impact. Relevance for future science and relationship to Decadal Survey: MISR has acquired more than 12 years of global observations, which are now being mined for volcanic plume eruptive style as well as injection height, greatly expanding our knowledge of volcano environmental impacts, globally. Continuing work includes a detailed study of particle property variations along the plumes for Iceland’s Eyjafjalljökull 2010 eruptions, using the MISR Research aerosol retrieval algorithm to provide additional particle type detail beyond the standard algorithm results (Kahn et al., 2012). The Decadal Survey ACE mission is scheduled to have a multi-angle polarimeter imager, a follow-on to MISR and MODIS, that would make possible continued monitoring of volcanic plume height and eruptive style, by applying the techniques developed here. Earth Sciences Division - Atmospheres
The unexpected stratospheric ozone response to the Mt. Pinatubo eruption – a puzzle solvedV. Aquila, L. D. Oman, R. S. Stolarski, A. R. Douglass, P. A Newman, Code 614, NASA GSFC On 15 June 1991 the Mt. Pinatubo eruption produced ~ 25 Mt of sulfur aerosol, increasing aerosols in the lower stratosphere by up to two orders of magnitude. Pinatubo aerosols were transported throughout the stratosphere, and reactions on their surfaces altered stratospheric composition at middle latitudes. Observations revealed the expected depletion of NO2 in both hemispheres, depletion of O3 in northern midlatitudes and surprising O3 increases at southern midlatitudes. This puzzle has been unsolved for years. We used the Goddard Earth Observing System chemistry-climate model (GEOSCCM) to quantify the changes in composition due to Pinatubo aerosols. For the first time we account for aerosol changes in both heating and chemistry. Upwelling increased due to aerosol heating in the tropics; downwelling increased mostly at southern midlatitudes because Pinatubo erupted in June. The extra downwelling increased the southern O3 column because the O3 vertical gradient is strong and the O3 chemical loss is slow. Extra downwelling did not affect NO2 because the NO2 vertical gradient is weak and the NO2 chemistry is fast. Figure 1: The increased downwelling due to the aerosol heating did not affect NO2 but increased the ozone during the year after the eruption and masked the chemical depletion until September 1992. Here we show the NO2 and ozone anomalies at southern midlatitudes in the observations and in our simulations. The solid lines are statistically significant. Earth Sciences Division - Atmospheres
Name: Valentina Aquila, NASA/GSFC, Code 614 E-mail: valentina.aquila@nasa.gov Phone: 301-614-6927 References: Aquila, V., L. D. Oman, R. S. Stolarski, P. R. Colarco, and P. A. Newman, Dispersion of the volcanic sulfate cloud from a Mount Pinatubo-like eruption Journal of Geophysical Research, in press. Aquila, V., L. D. Oman, R. S. Stolarski, A. R. Douglass, P. A. Newman, The response of ozone and nitrogen dioxide to the eruption of Mt. Pinatubo, submitted to Geophysical Research Letters Data Sources: Nimbus 7 Total Ozone Mapping Spectrometer (TOMS), Visible and Ultraviolet (UV/Vis) spectrophotometer Technical Description of Figures: Figure 1:The observed anomaly of the stratospheric NO2column is calculated from data taken with UV/Vis over Lauder, New Zealand using 1997-2003 as baseline. The observed anomaly of the total ozone column is calculated from TOMS observations using 1987-1990 as baseline. The TOMS data are averaged zonally over the latitudinal bands 30˚S-60˚S. In the same panels we show the simulated zonal mean anomalies of the stratospheric NO2 and total ozone column, calculated as the difference between model experiments with only chemistry perturbation (blue line), only dynamics perturbation (green line) and dynamics and chemistry perturbation (red line), respectively, and a control experiment without any perturbation. The solid lines are significant at the 1- level. Scientific significance: The lack of ozone depletion at southern midlatitudes after the eruption of Mt. Pinatubo has been a long-standing problem. Models including only the volcanic perturbation to the chemistry simulate significant ozone depletion, due to the increased rate of heterogeneous reactions caused by the large increase in aerosol surfaces. Several studies suggested that the ozone anomalies after the Mt. Pinatubo eruption might have been driven by the interannual variability of the atmospheric dynamics. In this work we quantify the ozone anomaly due to the volcanic perturbation to the heterogeneous chemistry, and to the dynamics that is caused by heating from the Pinatubo aerosols, and we show how the contributions from both effects can explain the observations. Relevance for future science and relationship to Decadal Survey: Our study shows that an increase of the aerosol layer might significantly affect ozone not only through chemical mechanism, but also through heating-induced changes of the stratospheric dynamics. Recent observations have reported an increase of the stratospheric aerosol layer. A study based on CALIPSO data attributes such increase to a series a small volcanic eruptions, but there might be an additional contribution from increasing tropospheric emissions. Long-term observations of the stratospheric aerosol layer are required to detect trends and identify the sources of such changes. Earth Sciences Division - Atmospheres