Download
1 / 13
130 likes | 297 Views
EVALUATION OF THE RADAR PRECIPITATION MEASUREMENT ACCURACY USING RAIN GAUGE DATA. Aurel Apostu Mariana Bogdan Coralia Dreve Silvia Radulescu. CONTENT. Correlational analysis of the precipitation data collected for the 2001 – 2003 period in the Muntenia region .

E N D
EVALUATION OF THE RADAR PRECIPITATION MEASUREMENT ACCURACY USING RAIN GAUGE DATA Aurel Apostu Mariana Bogdan Coralia Dreve Silvia Radulescu
CONTENT • Correlational analysis of the precipitation data collected for the 2001 – 2003 period in the Muntenia region. • Improving the accuracy and quality of the radar data by applying a correction factor and testing the consequences on a new sample.
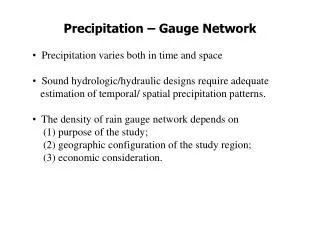
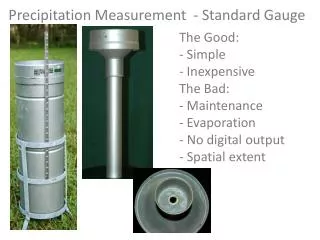
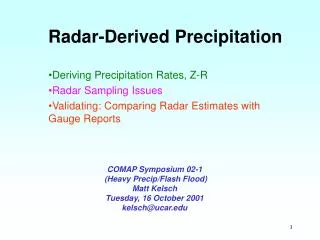
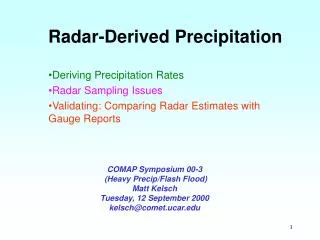
The rain gauge and the radar are both instruments that have a certain amount of measurement error, nevertheless data from rain gauges are still required for calibration of remote sensing techniques. • A high-density rain gauge network is a satisfactory way to measure the precipitation at the ground level, but the radar has the advantage of offering spatial continuity to the measurements. • Considering the deficiencies and advantages that has each instrument, the couple rain gauge network – radar can give a better estimation for the precipitation than the rain gauge network alone.
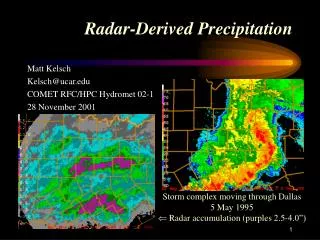
Given the foreground of the problem, the chosen statistical approach was to compute first a correlation coefficient and than to study the parameters of the variable difference between the measurements. The radar accumulation products ACC were generated from first elevation reflectivity, PPIZ 0.5 degrees, and from maximum column reflectivity, CMAX (at a time, not simultaneous). For this paper were used ACC products computed over 24 hours time intervals, and the correction factor automatically entered was F=1.
The radar data were compared to the rain gauge measured precipitation accumulation, for the same 24 hours intervals, from 35 meteorological stations located in the Bucharest radar surveillance area. • In order to eliminate the errors caused by the localization precision of each station or by the air movement near the rain gauge, the radar data were taken in two ways: the value on the station spot and the maximum value in a 5 km range relative to the station. • Thus four rows of radar data were obtained and consequently four pairs of random variables to analyse.
r(PPIZ) r5(PPIZ) r(CMAX) r5(CMAX) 0.68 0.668 0.625 0.595 Results for correlation: The computed values for r (Pearson parametric correlation) indicate a good linear relationship between the variables:
Statistical tests were performed to verify the significance of the correlation and the null hypothesis (no correlation between variables) was rejected. (A very important aspect for significance is the drawn samples size.) • Confidence intervals for populations’ coefficients and regression lines were computed. • The above analysis was repeated for each station separately, in order to determine the weight of every rain gauge in the network, in the strength of the linear relationship. • Several special cases were carefully considered (correlation coefficient less than 0.4 or better correlation for radar ACC products generated from CMAX).
Improving the accuracy and quality of the radar data can be achieved by: modifying the coefficients of the Z-R relationship, uniformly applying a correction factor (obtained using the rain gauge data) to the radar data • Two multiplicative factors were tested: n n n F1= Pi / R i F2= ( 1/ n) Pi / R i I=1I=1 I=1 • Using F1 the radar data are weighted by the rain quantity, while using F2 all radar-rain gauge data pairs have equal weights. The corrections refer to the errors due to the radar calibration and Z-R relationship.
Analyzing the parameters of the variable difference (mean and standard deviation) F1 has been chosen as the best way of getting the two methods of measurement agree much closer. It’s value is F1 = 1.95 and it is automatically applied to ACC products generated from first elevation reflectivity (PPIZ). • The consequences of multiplying the radar data by F1 were analyzed on a sample of 497 data collected from the moment of its application until February 2005. • The purpose of applying the correction factor F1 has been achieved since the mean and the standard deviation of the differences between the measurements had decreased. m1 = - 2.34; m2 = - 0.7 σ1 = 6; σ2 = 5.43.
Conclusions: • There is a strong linear relationship between precipitation data estimated with DWSR-2500C weather radar and precipitation data measured with rain gauge. • The correlation between radar data and rain gauge data is better when ACC products are generated using PPIZ first elevation products. • For mountain stations or stations located at a great distance from the radar site (120 – 150 km) the correlation is better for the accumulations generated using CMAX. • The multiplicative factor that best adjusts the 24 hours radar accumulation data for Muntenia region is 1.95 applied to ACC products generated from first elevation reflectivity.