Download
1 / 46
470 likes | 680 Views
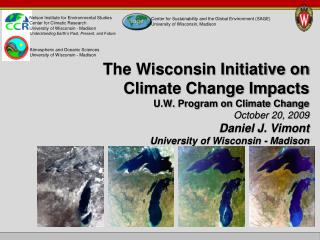
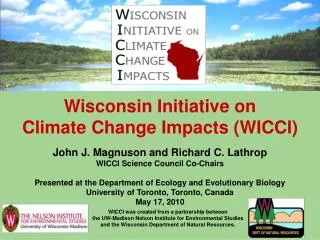
Wisconsin Initiative on Climate Change Impacts (WICCI). John J. Magnuson and Richard C. Lathrop WICCI Science Council Co-Chairs Presented at the Department of Ecology and Evolutionary Biology University of Toronto, Toronto, Canada May 17, 2010.

E N D
Wisconsin Initiative on Climate Change Impacts (WICCI) John J. Magnuson and Richard C. Lathrop WICCI Science Council Co-Chairs Presented at the Department of Ecology and Evolutionary Biology University of Toronto, Toronto, Canada May 17, 2010 WICCI was created from a partnership between the UW-Madison Nelson Institute for Environmental Studies and the Wisconsin Department of Natural Resources.
Acknowledgments: Alison Coulson, Nelson Institute, UW-Madison *Chris Kucharik, Nelson Institute’s Center for Sustainability and Global Environment, and Dept. Agronomy, UW-Madison Dave Lorenz, Nelson Institute’s Center for Climatic Research (CCR), UW-Madison Mike Notaro, UW-Madison CCR Shawn Serbin, Dept. Forestry and Wildlife Ecology, UW-Madison *Dan Vimont, UW-Madison CCR Intergovernmental Panel on Climate Change (IPCC), 2007 (4th Assessment Report) *Co-Leaders of WICCI’s “Wisconsin Climate Working Group” WICCI was created from a partnership between the UW-Madison Nelson Institute for Environmental Studies and the Wisconsin Department of Natural Resources.
Ice-on Day 2007 One of many signs of warming in Wisconsin... Lake Mendota Photo: Peter W. Schmitz Decrease in duration of ice cover on lakes Source: J. Magnuson, UW-Madison
Earlier arrival of spring in Wisconsin Nina Leopold Bradley Photo: Jeffrey Phelps, Milw. Journal Sentinel 55 ecological indicators of spring occurred on average 1.2 days earlier per decade from 1936 to 1998. Source: Bradley et al., 1999. Phenological changes reflect climate change in Wisconsin. Proc. Natl. Acad. Sci., 96: 9701-9704. Slide adapted from C. Kucharik, UW-Madison Leopold Shack Photo: Aldo Leopold Foundation
Circa 1930 Weather Station Network for Wisconsin (Daily temperature and precipitation data since 1950) Source: Map from Serbin and Kucharik (2009); photos from C. Kucharik, UW-Madison Photo credit: NOAA
Change in Annual Average Temperature (°F) from 1950 to 2006 Statewide average 1.5°F warmer (from Serbin and Kucharik 2009)
Change in Average Temperature (°F) from 1950 to 2006 Spring Winter The greatest amount of warming is occurring in Winter and Spring, especially in northwest Wisconsin. Summer Fall (from Serbin and Kucharik 2009)
Change in Daily Minimum and Maximum Temperatures (°F) Winter Spring Summer Fall Daily High Nighttime lows are warming faster than daytime highs, especially in summer. Daily Low (from Serbin and Kucharik 2009)
Decline in extremely cold winter nights, especially in northwest Wisconsin Very little change in hot summer days Extreme Temperature Trends Change in the frequency of <0°F nights per year from 1950 to 2006 Change in the frequency of ≥90°F days per year from 1950 to 2006 (from Serbin and Kucharik 2009)
6 – 20 days earlier 3 – 18 days later Change in Wisconsin’s Seasons Change in Date of Last Spring Freeze from 1950 to 2006 Change in Date of First Fall Freeze from 1950 to 2006 (from Serbin and Kucharik 2009)
Change in the Length of the Growing Season In Days from 1950 to 2006 Increase of up to 4 weeks (from Serbin and Kucharik 2009)
Recent Precipitation Trends Change in Annual Average Precipitation (inches) from 1950 to 2006 Statewide average 15% increase, but highly variable across Wisconsin (from Serbin and Kucharik 2009)
~15% increase 10–15% increase 5–10% decrease ~20% increase ~15% increase Change in Average Precipitation (inches) from 1950 to 2006 Winter Spring Summer Fall (from Serbin and Kucharik 2009)
Climate Modeling: Used 14 Global Climate Models (GCM’s) having daily data in IPCC 2007 assessment Downscaling verified using same Wisconsin weather station data analyzed for historical climate trends Provides a range of probable climate changes (probability distribution) essential for impact assessments IPCC 2007 Global Climate Model grid Downscaled (8x8 km grid) Downscaling: Focus global projections to a scale relevant to climate impacts in Wisconsin Source: Adapted from D. Vimont, UW-Madison
Annual Temperature Change Projected Change in Annual Average Temperature (°F) from 1980 to 2055 Probability Distribution of 14 Global Climate Model Projections 50% probability temperature (plotted on maps) 90% chance of exceeding this temperature 10% chance of exceeding this temperature Wisconsin projected to warm by 4 – 9 °F by mid-21st Century Source: Adapted from D. Vimont, UW-Madison
Projected Change in Seasonal Temperatures 1980 to 2055 (°F) Winter Spring Warming is most pronounced in winter Summer Fall
Fewer extremely cold winter nights More hot summer days Extreme Temperature Projections Projected change in the frequency of <0°F nights per year from 1980 to 2055 Projected change in the frequency of ≥90°F days per year from 1980 to 2055
Probability Distributions of 14 Climate Model Projections by Month Projected Change in Precipitation from 1980 to 2055 Change in Annual Average (inches) Models predict winter and early spring will be wetter Models uncertain about amount of summer rainfall Source: Adapted from D. Vimont, UW-Madison
Monthly Frequency of >3-inch Rainstorms in 24 hr Madison, Wisconsin (Future projections averaged for all 14 GCM’s) 1961-2000 2046-2065 2081-2100 Increase in extreme precipitation events during spring & fall Exceedance Probability Source: K. Potter, UW-Madison. Based on statistically downscaled data developed by Kucharik, Lorenz, Notaro, and Vimont, UW-Madison.
How Could Wisconsin Adapt to Climate Change? Photo: WDNR
Change in rate of GHG emissions* = Very little = Minor = Major Mitigation vs. Adaptation *Scenarios from IPCC 2007 Mitigate Adapt 3.6 ºF Modified from: IPCC 2007
Wisconsin Initiative on Climate Change Impacts (WICCI) Objectives: Assess and anticipate climate change impacts on specific Wisconsin natural resources, ecosystems and regions Evaluate potential effects on industry, agriculture, tourism, and other human activities Develop and recommend adaptation strategies
Collaborative and Interdisciplinary Science Council: Members represent an array of disciplines and expertise within the University of Wisconsin System (UW), the Wisconsin Department of Natural Resources (WDNR) and other state and federal agencies, universities and institutions. Working Groups: Experts in working group topic areas coming from WDNR, other state and federal agencies, UW, non-profit organizations, and private sector. Working groups are a mix of researchers, managers, and practitioners from around the state. Advisory Committee: Stakeholders from across Wisconsin who bring a wide variety of perspectives including representatives from the utilities, state and local government, agriculture, transportation, tourism, forestry, public health, conservation and environmental organizations, Native Americans, etc. Outreach Committee: Experts in communications and outreach from UW-Madison, UW Sea Grant, UW-Extension, and WDNR.
Human Health Milwaukee Water Resources Coldwater Fish Soil Conservation Stormwater Agriculture Wisconsin Climate Wildlife Loss of Winter Green Bay Plants & Natural Communities Coastal Communities Central Sands Hydrology Forestry Current & Developing Working Groups
Present Climate Projected Climate Impact threshold Probability Climate Variable Adaption Probability Climate Variable How will climate projections be used? Risk: Probability of climate event occurring multiplied by severity of impact Identify threshold / response surface Define present day risk with present day probability distribution Compare future risk with future probability distribution Explore how adaptation strategies can impact risk Source: Adapted from Dan Vimont, UW-Madison
Loss of Winter in Wisconsin Culture Sense of Place Recreation Tourism Photo: UW Center for Limnology Photo: R. Lathrop Photo: J. Patz
A Clear Threshold29°C and 50% rain vs. Snow Shorter Snow Season Warmer Winters Snow cover changes Madison Wisconsin Present Day End of Century Snow Rain Dan Vimont, UW-Madison
Probabilities of Snow vs. Rain Dan Vimont
A Clear Threshold Trout in Wisconsin Streams July-August Water Temperatures < or = 22°C Photo Matt Mitro WDNR
NOW 17,900 km of stream 12,500 km of stream Present Matt Mitro & John Lyons WDNR
+1°C 4,800 km of streams -73% 16,000 km Of streams +28% Present Gain Loss Matt Mitro & John Lyons WDNR
+3°C 2,100 km -83% 300 km -98% Present Gain Loss Matt Mitro & John Lyons WDNR
+5°C 500 km -96% 0 km -100% Present Gain Loss Matt Mitro & John Lyons WDNR
Catfish Gains Do Not Offset Trout losses °C Present + 1 + 3 +5 John Lyons W DNR 2009
Expect the Unexpected John Lyons W DNR 2009
Impacts of Warmer Winters on Logging Photo: Karin Fassnacht, WDNR Forestry Working Group Loss of Northern Tree Species
Loss of natural habitats and biodiversity (also Natural Places Working Group) Spruce grouse Loss of species Showy lady’s slipper Photo: Karl Martin, WDNR Overabundance of other species Dragon’s mouth orchid Photo: T. Meyer, WDNR Photo: WDNR Wildlife Working Group
Increase in vector-borne infectious diseases Photo: Gary Braasch Combined sewer overflow from Milwaukee entering Lake Michigan Increase in respiratory health problems from air pollution and climate change Photo: Milwaukee Metropolitan Sewerage Dist. Photo: www.topnews.in Human Health Working Group Increase in waterborne infectious diseases from more intense storms
Madison, WI, July 2006 Photo: Gordy Stephenson Stormwater Working Group Damage to communities and transportation systems from extreme storm events Rock Springs, WI, June 2008 Photo: Michael Kienitz
WICCI’S First Adaptive Assessment Report Fall 2010 Synthesis of climate impact assessments of WICCI Working Groups Recommendations on adaptation strategies for decision makers
Future Activities • Expanding Outreach Efforts • New website now online • Newsletters • Outreach Committee initiatives • Collaboration beyond Wisconsin’s borders • Upper Great Lakes Region • USGS Regional Science Hub • Subsequent Adaptive Assessments
http://www.wicci.wisc.edu/ WICCI was created from a partnership between the UW-Madison Nelson Institute for Environmental Studies and the Wisconsin Department of Natural Resources.