Download
1 / 1
10 likes | 112 Views
BACKGROUND. METHODS. RESULTS (CONT.). Climate projections suggest an increase in heavy precipitation with increased intensity and frequency of events over the next century. There is a need to better understand the relationship between these events and health outcomes for the state.

E N D
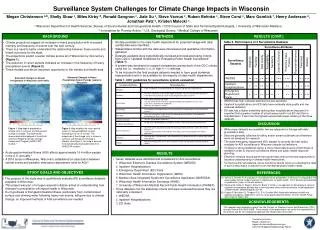
BACKGROUND METHODS RESULTS (CONT.) • Climate projections suggest an increase in heavy precipitation with increased intensity and frequency of events over the next century. • There is a need to better understand the relationship between these events and health outcomes for the state. • The projections predict a wetter climate across all of Wisconsin by mid-century (Figure 1). • The reduction in return periods indicates an increase in the frequency of heavy precipitation events (Figure 2). • These models provide an important opportunity to link climate and health data. Table 2. Performance of 3 Surveillance Datasets • All data available to the state health department for potential linkage with daily rainfall data were identified. • Stakeholders familiar with the data were interviewed and qualitative information gathered. • Datasets available were systematically reviewed and evaluated using criteria from CDC’s “Updated Guidelines for Evaluating Public Health Surveillance” (Table 1). • A system was developed to support comparisons across each of the CDC criteria using low (+), moderate (++), or high (+++) rankings. • To be included in the final analysis datasets needed to have good statewide representation and to be available for the majority of state health departments. Surveillance System Challenges for Climate Change Impacts in Wisconsin Simulated Changes in Heavy Precipitation Return Periods (years) in Wisconsin Simulated Changes in Annual Precipitation in Wisconsin (2041-2070) Table 1. CDC guidelines for surveillance system evaluation • WEDSS has high outbreak detection but low sensitivity. • Inpatient hospitalizations and ED data have moderate data quality and low outbreak detection. • ED data has a higher sensitivity ranking than hospitalizations because it is expected that a greater number of actual cases result in an ED visit than a hospitalization. It also has the highest representativeness ranking of the three datasets. DISCUSSION Percent Change in Annual Total Precipitation Percent Change in Return Period by Event Intensity Figure 1. Map depicts precipitation change (cm) in contours and the percent change is shaded. The dynamically downscaled data displayed is from North American Regional Climate Change Assessment Program (NARCCAP) models.1 Figure 2. Mapdisplays the return period (years) of daily precipitation events exceeding 10.2 cm (3 inches). The magnitude of the change (cm) is shown in contours and the percent change is shaded. Like Figure 1, the map is derived from dynamically downscaled data from NARCCAP models.1 • While many datasets are available, few are adequate for linkage with daily precipitation data. • Data are generally collected for billing and/or severe outbreaks and therefore were not designed for research. • The state emergency department (ED) dataset is currently the best option available for AGI surveillance in Wisconsin despite its limitations. • To detect a strong statistical signal, a more robust data source of AGI illness is needed in order to improve surveillance efforts and public health response planning. • Electronic medical record patient encounter data may be the best opportunity to advance understanding of climate-health interactions. • To improve AGI surveillance, future directions should focus on collecting the data in such a way that is conducive to environmental public health needs. Megan Christenson a,b, Shelly Shaw c, Miles Kirby d, Ronald Gangnonc, Jiale Xu c, Steve Vavrus c, Ruben Behnke c, Steve Corsi e, Marc Gorelick f, Henry Anderson a, Jonathan Patz c, Kristen Malecki c a Wisconsin Department of Health Services, Bureau of Environmental and Occupational Health, b CDC/Council of State and Territorial Epidemiologists, c University of Wisconsin-Madison, d Innovations for Poverty Action, e U.S. Geological Survey, f Medical College of Wisconsin • Acute gastrointestinal illness (AGI) affects approximately 16.4 million people in the U.S. annually.2 • A 2010 study in Milwaukee, Wisconsin, established an association between rainfall events and pediatric emergency department visits for AGI.3 RESULTS • Seven datasets were identified and considered for AGI surveillance: • 1. Wisconsin Electronic Disease Surveillance System (WEDSS) • 2. Inpatient Hospitalizations • 3. Emergency Department (ED) Visits • 4. Wisconsin Health Information Organization (WHIO) • 5. Madison Area Integrated Syndromic Surveillance Application (MARISSA) • 6. Wisconsin Health Information Exchange (WHIE) • University of Wisconsin Medical Record Public Health Information (PHINEX) • Three datasets met the statewide criteria and were evaluated because they are nationally consistent: • 1. WEDSS • 2. Inpatient Hospitalizations • 3. ED Visits STUDY GOALS AND OBJECTIVES REFERENCES • The purpose of the study was to qualitatively evaluate AGI surveillance datasets available in Wisconsin. • This project was part of a larger research initiative aimed at understanding how changes in precipitation will impact health in Wisconsin. • Our hypothesis is that gastrointestinal illness, particularly from contaminated surface and drinking water following heavy rain events, will grow due to climate change, so improved methods of AGI surveillance are needed. • Vavrus S, Behnke R. A comparison of projected future precipitation in Wisconsin using global and downscaled climate model simulations: implications for public health. 2012. Manuscript submitted for publication (copy on file with authors). • Messner M, Shaw S, Regli S, Rotert K, Blank V, Soller J. An approach for developing a national estimate of waterborne disease due to drinking water and a national estimate model application. J Water Health. 2006;4(Suppl 2):201-40. • Drayna P, McLellan SL, Simpson P, Li S-H, Gorelick MH. Association between rainfall and pediatric emergency department visits for acute gastrointestinal illness. Environ Health Persp. 2010;118(10):1439-1443. ACKNOWLEDGEMENTS • This research was funded by a grant from the Centers for Disease Control and Prevention (CDC) through Grant # 5U01EH000428. The contents of this presentation are solely the responsibility of the authors and do not necessarily represent the official views of the CDC. Contact information: Megan Christenson megan.christenson@wisconsin.gov CDC/CSTE Applied Epidemiology Fellow