Download
1 / 50
500 likes | 611 Views
Map scale is crucial in cartography, representing the relationship between distances on a map and actual distances on the ground. Scale types include verbal scales (e.g., "1 cm represents 100 km"), bar scales, and representative fractions (e.g., RF of 1:24,000). Understanding scale issues—like unit-to-unit orientation—is vital, as data from different scales can vary widely, impacting analysis. Additionally, color usage in map design affects data representation. Addressing color blindness in visualization and employing effective color schemes is essential for accurate communication in cartographic data.

E N D
What is map scale? The scale of a map is the relationship between a unit of length on the map and a unit of length on the ground.
Map Scales Verbal scale “One cm represents 100 km” Bar scales (graphical) Representative fraction (RF) 1:24,000
Representative Fraction A 0.025 inch line on a1:24,000scale map represents50ft (600 in) on the ground A 0.025 inch line on a1:200,000scale map represents almost417ft on the ground
Scale Issues Beware of scale statements 1:200 (“one to two hundred”) does this mean unit-to-unit (one inch on the map equals 200 inches on the ground) or not unit-to-unit (one inch on the map equals 200 feet on the ground) For this course, all scale statements will be assumed unit-to-unit
Scale Issues large scale vs. small scaleTo a geographer:1:2,000,000 is small scale1:200 is large scale
Importance of Scale Scale of data plays an important role, and frequently causes problems All spatial phenomena have scale dependent behavior/properties Be aware of: Data source scale Mixing data from different source scales Appropriateness of output scale
Scale Issues Data from different sources and scales can vary widely 1:100,000 scale data from USGS DLG
Scale Issues 1:1,000,000 scale data from DCW (DMA)
Scale Issues 1:2,000,000 scale data from USGS DLG
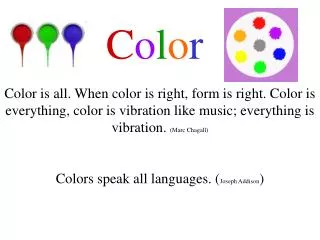
Displaying data: colors What can color do? Label Measure Represent or imitate reality Beautify From Tufte 1990 Wabern, 1983
Displaying data: colors Primary home heating fuel. U.S. Department of Commerce From Tufte 1990
Displaying data: colors Primary home heating fuel. U.S. Department of Commerce From Tufte 1990
Displaying data: colors From Tufte 1997
Displaying data: colors From Tufte 1997
Displaying data: colors From Tufte 1997
Color Blindness http://jfly.iam.u-tokyo.ac.jp/color/
Color Blindness http://jfly.iam.u-tokyo.ac.jp/color/
Color Blindness http://jfly.iam.u-tokyo.ac.jp/color/
Color Blindness http://jfly.iam.u-tokyo.ac.jp/color/
Color Blindness http://jfly.iam.u-tokyo.ac.jp/color/
Color Models RGB
Color Models CMYK
Redundant Coding http://jfly.iam.u-tokyo.ac.jp/color/
Redundant Coding http://jfly.iam.u-tokyo.ac.jp/color/
Color Schemes Dr. Cynthia Brewer / Department of Geography / The Pennsylvania State University http://www.personal.psu.edu/faculty/c/a/cab38/ColorSch/Schemes.html
Color Schemes Dr. Cynthia Brewer / Department of Geography / The Pennsylvania State University http://www.personal.psu.edu/faculty/c/a/cab38/ColorSch/Schemes.html
Color Schemes Dr. Cynthia Brewer / Department of Geography / The Pennsylvania State University http://www.personal.psu.edu/faculty/c/a/cab38/ColorSch/Schemes.html
Color Schemes Dr. Cynthia Brewer / Department of Geography / The Pennsylvania State University http://www.personal.psu.edu/faculty/c/a/cab38/ColorSch/Schemes.html
Color Schemes Dr. Cynthia Brewer / Department of Geography / The Pennsylvania State University http://www.personal.psu.edu/faculty/c/a/cab38/ColorSch/Schemes.html
Color Schemes Dr. Cynthia Brewer / Department of Geography / The Pennsylvania State University http://www.personal.psu.edu/faculty/c/a/cab38/ColorSch/Schemes.html
Color Schemes Dr. Cynthia Brewer / Department of Geography / The Pennsylvania State University http://www.personal.psu.edu/faculty/c/a/cab38/ColorSch/Schemes.html
Color Schemes Dr. Cynthia Brewer / Department of Geography / The Pennsylvania State University http://www.personal.psu.edu/faculty/c/a/cab38/ColorSch/Schemes.html
Color Schemes Dr. Cynthia Brewer / Department of Geography / The Pennsylvania State University http://www.personal.psu.edu/faculty/c/a/cab38/ColorSch/Schemes.html
Color Schemes Dr. Cynthia Brewer / Department of Geography / The Pennsylvania State University http://www.personal.psu.edu/faculty/c/a/cab38/ColorSch/Schemes.html
Color Schemes Dr. Cynthia Brewer / Department of Geography / The Pennsylvania State University http://www.personal.psu.edu/faculty/c/a/cab38/ColorSch/Schemes.html
Color Schemes Dr. Cynthia Brewer / Department of Geography / The Pennsylvania State University http://www.personal.psu.edu/faculty/c/a/cab38/ColorSch/Schemes.html
Color Schemes Dr. Cynthia Brewer / Department of Geography / The Pennsylvania State University http://www.personal.psu.edu/faculty/c/a/cab38/ColorSch/Schemes.html
Color Schemes Dr. Cynthia Brewer / Department of Geography / The Pennsylvania State University http://www.personal.psu.edu/faculty/c/a/cab38/ColorSch/Schemes.html
Color Schemes Dr. Cynthia Brewer / Department of Geography / The Pennsylvania State University http://www.personal.psu.edu/faculty/c/a/cab38/ColorSch/Schemes.html
Color Schemes Dr. Cynthia Brewer / Department of Geography / The Pennsylvania State University http://www.personal.psu.edu/faculty/c/a/cab38/ColorSch/Schemes.html
Dr. Cynthia Brewer / Department of Geography / The Pennsylvania State University http://www.personal.psu.edu/cab38/ColorBrewer/ColorBrewer.html
Homework Read: “Creating Feature Datasets & Vector Editing” & “Creating and Modifying Tables” Start working on assignment #4 -- Due April 26.