Download
1 / 40
400 likes | 569 Views
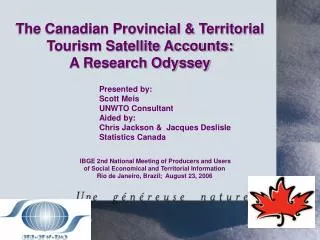
The Canadian Provincial & Territorial Tourism Satellite Accounts: A Research Odyssey. Presented by: Scott Meis UNWTO Consultant Aided by: Chris Jackson & Jacques Deslisle Statistics Canada. IBGE 2nd National Meeting of Producers and Users

E N D
The Canadian Provincial & Territorial Tourism Satellite Accounts:A Research Odyssey Presented by: Scott Meis UNWTO Consultant Aided by: Chris Jackson & Jacques Deslisle Statistics Canada IBGE 2nd National Meeting of Producers and Users of Social Economical and Territorial Information Rio de Janeiro, Brazil; August 23, 2006
OVERVIEW Context and justification Concepts and definitions Methodology Results & findings Conclusions & future work
CANADA 10 Provinces 3 Regions Nunavut CANADA Yukon North West Territories Labrador Alberta Manitoba Newfoundland Quebec British Colombia Ontario Saskatchewan Nova Scotia New Brunswick Prince Edward Isle.
STC-CTC Technical Partnership -1989-2006 TECHNICAL PARTNERSHIP Statistics Canada & Canadian Tourism Commission Objective independent statistics agency Industry champion, resources, uses Shared goals and objectives Interdependence Mutual respect & understanding
CTC MISSION • Market & brand Canada as a tourism destination • Provide accurate and timely information • Aid government and industry decision making MANTRA • Industry lead, market driven, research based CTC: Creation (1995)--Legislation, Jan,2001
History: A New Statistical Instrument Tourism Satellite Account • An account, not a model • Set of statistics measuring structure and scope of tourism outputs, expenditures and employment • Measure monetary values of commercial transactions • Integrates visitor demand data with supply data from a dispersed set of industries • Separate linked extension of SNA • Tourism specific summary comparable with other industries and total economy
TSA History: HISTORY OF TSA • Concept of tourism satellite accounts, France 1979 • Canadian TSA recommendations, 1989 • TSA principles and guildelines, Ottawa Conference, 1991 • Release of 1st Canadian TSA, 1994 • WTO/OECD international standard projects, 1996-1999 • Quarterly national tourism indicators, 1996 • Adoption by UNSC of TSA international standard, 2000 • Release of TSA:RMF, Vancouver, 2001 • Release of 1st Provincial/Territorial TSA for Canada, 2002
PTSA History PTTSA History: • Provincial Responses to NTSA-NTI, 1994-1999 • PTSA Feasibility study proposals (Québec/CTC/STC) 1995 • Feasibility study of provincial dimension to NTSA 1997-1998 • Development proposal, partnership and contract discussions Alberta/Québec/CTC/STC) 1999-2001 • Project initiation, 1999-2000 • Project completion, April, 2002 • Revised & updated 2nd PTSA Benchmark update, June, 2003
PTTSA Rationale: WHY A PROVINCIAL/TERRITORIAL TSA? • Tourism unevenly distributed • Shared federal-provincial responsaibility • NTFD findings re regional data • Regional interest stimulated by CTSA release • Improve credibility and consistency of tourism economic measurement • Common conceptual framework -- the System of National Accounts. • Comparbility within & between provinces, with national economy & economic sectors • Strengthen capacities for tourism analysis and research
PTTSA: Design Decisions Feasibility Study Decisions • Concepts and methods from national accounts and TSA • Reference year - 1996 • Estimates cover all provinces and territories • Level of detail: 2 digit industries and commodities
PTTSA – Design Decisions List of 2 digit (“S” level) industries (NAICS 97) • Goods Producing Industries Agriculture, Fishing & Trapping, Logging & Forestry Mining, Manufacturing, Construction, Utilities • Services Producing Industries • Transportation & Storage, Communications, Wholesale Trade, Retail Trade, Finance & Insurance, Real Estate, Business Services, Government Services, Education, Health & Social Services, Accommodation, Food & Beverage, Other Services
PTTSA - Methodology: LIST OF “S” TOURISM COMMODITIES • Passenger Transportation: • Passenger air transportation • Private vehicles: Vehicle fuel, repairs and parts. • Others: Water, rail, bus, taxis, vehicle rental • Accommodation:Motels, hotels, camping grounds, outfitters and other accommodation • Food and Beverage Services:Meals, alcoholic beverages • Other Tourism commodities:Recreation and entertainment, travel agency services and pre-trip expenses • Other Non-tourism Commodities Purchased by Visitors: Groceries, alcoholic beverages purchased from stores, souvenirs, urban transit, parking and other services and commodities
PTTSA - Methodology: LIST OF “S” TOURISM INDUSTRIES • Transportation:Air, water, rail, bus, taxis, vehicle rental and vehicle fuel, urban transit, parking. • Accommodation:Motels, hotels, camping grounds, outfitters and other accommodation. • Food and Beverage Services • Other Tourism Industries:Includes recreation and entertainment services, travel agencies and tour operators. • Other Industries:Includes non-tourism industries benefiting from tourism, e.g. retail, by providing commodities bought by visitors including groceries, alcoholic beverages, motor vehicle fuel, parts and repairs, pre-trip expenses, toiletries, etc.
PTTSA - Methodology: CONCEPTS • The provincial/territorial TSA (PTTSA) is based on the accounting principles of the System of National Accounts (SNA) • Tourism is not and activity identified in the SNA • Consequently, construction of the PTTSA necessitates the division of the relevant SNA economic activities into their tourism and non-tourism components
PTTSA - Methodology: DEFINITION • Tourism is defined as « the activities of persons traveling away from their usual environment, for a period less than 12 consecutive months for the purposes of leisure, business or other purposes» (UNWTO) • « Usual environment » operationalized as: • Trips greater than 80 kilomètres from one’s residence (one direction) • SAME definition of tourism applies to all provinces & regions • SAME tourism commodities and industries for all provinces & regions of Canada
PTTSA - Methodology: DATA SOURCES • Tourism supply, GDP and employment • Provincial input-output accounts (1990) • GDP by industry accounts • Business surveys • Administrative records • Labour productivity data base • Tourism demand • Canadian Travel Survey • International Travel Survey • Survey of Income and Expenditures • Reference years 1996 and 1998 chosen based on the optimal availability of all these data sources
PTTSA - Methodology: METHODOLOGY • Goal of the PTTSA - to measure tourism economic activity in terms of tourism supply, tourism demand, tourism GDP and tourism employment • Estimates MUST be calculated in the following order
PTTSA - Methodology: TOURISM SUPPLY – METHODOLOGY • Tourism domestic supply = total production of tourism commodities and services in Canada • Total tourism supply NOT equivalent to total tourism demand • Essential to FIRST correctly specify and calculate total tourism supply
PTTSA - Methodology: TOURISM SUPPLY – CALCULATION • Break down I/O « S » level industries into component sub-industies • Discern and keep only those sub-industries that serve visitors directly • Example: F&B industry splits-- restaurants, bars, take-out restaurants and caterers; • Drop caterers • Split out and remove industry supply not linked to tourism commodities, (consumed direcly by visitors) • e.g. caterers – keeps meals but drops royalties • Calculate total tourism supply all tourism commodities of each industry/sub-industry
PTTSA - Methodology: DEMAND – METHODOLOGY • Tourism demand is defined as the total expenditures of « visitors »-- including both tourists and excursionists • Components of total tourism demand • Domestic (intraregional) demand • International demand • Interregional demand (new aggregate)
PTTSA - Methodology: Demand – Methodology • Demand comes from survey data: • Canadian Travel Survey (CTS) (renamed Travel Survey of Resident Canadians) for domestic demand • International Travel Survey (ITS) for international demand • Many iterative adjustments & calculations are made to reconcile demand with supply • Pre-trip expenses • Domestic fares of international trips of Canadians • Other non-measured demand (ex. tips) • Domestic tourism for territorial residents (Source:SHE) • Balancing of demand with supply
All Other Areas of System of National Accounts Tax information Canadian Tourism Satellite Account Other Information Such as Manufacturing data International Trade data Reconciliation Processes Business information Such as Profits, capital investment, revenues, expenses Labour Force Survey Input Output System System of National Accounts Supply Surveys Survey of Employment, Payroll and Hours Demand Surveys
PTTSA Methodology: Reconciliation BALANCING SUPPLY WITH DEMAND • Commodities expenditures VS industry revenues • Tourism demand VS supply by commodity • Tourism inputs VS outputs by industry • Gross outputs VS all inputs • Repeats all of the above at each geographical level • Iterative & interactive process -- “requiring high degrees of professional judgment”
PTTSA Methodology: LINKAGE BETWEEN COMMODITIES & INDUSTRIES • Demand is estimated for groups of goods and services (commodities) • GDP and employment, however, must be calculated by industry • Supply can be calculated either for groups of commodities or by industry/sub-industry categories which establishes the link between demand and GDP • The link is a demand/supply ratio for each commodity • This ratio is then applied to each industry category to calculate GDP and employment in the industry space
Tourism GDP can be defined as a simple value of domestic production of tourism goods and services within the limits of a particular region Only direct GDP is measured as opposed to indirect GDP and induced GDP Componants of GDP include: Labour income, i.e. salaries and wages Supplementary work-related income Mixed revenue Other operating surplus -- profits & depreciation PTTSA Methodology: TOURISM GDP - METHODOLOGY
%TS/TVA Proportion of Tourism GDP by Industry Category Source: Statistics Canada (1996 PTSA and 2001NTI)
PTTSA Methodology: TOURISM EMPLOYMENT • Tourism employment is the sum of all employees who contribute to tourism production: • Includes all direct employment: • Indirect employment and induced employment are not included • Includes self-employed workers and non-renumberated family workers • Seasonal full-time and part-time employment are both includedbut they are not calculated as full-time equivalents • Same industrial ratios as Tourism GDP used to calculate the tourism employment portion of each sub-industry/industry
Tourism Employment (T) Total employment in all industries (T) (A+B) Employment related to tourism industries A= Employment of tourism industries generated by other users (local & non-visitor consumption) B= Employment of tourism industries generated by consumption of visitors (A) (B) (B+C) = Total employment generated by tourism consumption C= Part of employment in non-tourism industries but generated by visitor consumption (C)
PTTSA Results: PROVINCIAL/TERRITORIAL RESULTS • Tourism expenditures • GDP/Employment proportions • Sources of demand • Trade balances
PTTSA Results: Provincial Distribution (%)of Tourism Expenditures (1996) Source: Statistics Canada (1996 PTSA))
Tourism GDP /total GDP Employment in tourism /total employment (percentage) Yukon 4.8 8.1 British Columbia 3.5 4.7 Prince Édward Isle. 3.1 4.6 Nova Scotia 2.6 4.1 Newfoundland/Labrador 2.3 3.9 Manitoba 2.3 3.2 Canada, 1996 2.3 3.7 Québec 2.2 3.3 Alberta 2.2 3.9 Ontario 2.1 3.5 NWTerritoires/Nunavut 2.1 4.3 New Brunswick 2.0 3.6 Saskatchewan 1.8 3.3 Provincial Tourism Satellite Account, 1996
PTTSA Results: Provincial Distribution of Tourism GDP Shares (1996) Canada (1998)2.3 % Source: Statistics Canada (1996 PTSA and 2001NTI)
InternationalDemand Domestic iDemand Interregional Demand (percentage) Yukon 62.7 17.0 20.2 British Colombia 39.1 38.3 22.6 Ontario 38.1 48.1 13.8 Canada, 1996 32.8 47.2 20.0 Prince Edward Island 30.8 15.7 53.5 Québec 28.8 52.9 18.3 Alberta 28.0 47.6 24.4 Nova Scotia 24.6 42.9 32.5 New Brunswick 21.8 43.5 34.7 NW Territoires/Nunavut 19.6 42.0 38.4 Manitoba 16.3 49.1 34.6 Newfoundland/Labrador 15.3 56.0 28.7 Saskatchewan 9.4 62.6 28.0 SOURCES OF TOURISM DEMAND, PROPORTIONS, 1996
PTTSA Results: Intraregional demande = the largest part of tourism $Interregional demand = new aggregate indicator % SOURCES OF TOURISM DEMAND, 1996 $54.6 Billion (2001)
Total balance of tourism trade Interregional balance of tourism trade International balance of tourism trade (millions de dollars, Canadian) British Colombia 202 430 -228 Prince Édward Isle. 83 48 35 Yukon 60 4 56 Nova Scotia 50 56 -6 Newfoundland/Labrador 25 -2 27 NW Territoires/Nunavut 21 9 12 New Brunswick -150 14 -164 Alberta -406 -63 -344 Saskatchewan -426 -128 -298 Manitoba -484 -66 -418 Québec -776 63 -839 Ontario -2958 -366 -2592 Canada, 1996 -4759 0 -4759 REGIONAL TOURISM TRADE BALANCES, 1996
PTTSA Findings: FINDINGS • Importance of tourism in terms of GDP and employment varies significantly from one province/territory to another • Provinces/territories ranking highest are those who depend more on international and interprovincial sources of tourism demand • Tourism plays a relatively more siginficant role in some of the smallest regional economies • Generally, the same regions also have a favourable tourism balance of trade
PTSA Challenges: CHALLENGES • Geographic vs commodity aggregation • Detailed results vs confidentiality • Reconciliation of data on supply with demand • Questions and lack confidence in the quality of estimates for small regional samples and industries • Comparability with previous provincial estimates from economic models • Comparability with other existing provincial/regional data sources • Financial participation of ALL provincial/regional partners • Communications, communications, communications…! • Politics, politics, politics, politics…!
PTSA: Future Vision POSSIBLE FUTURE DEVELOPMENTS • Provincial Tourism Indicators • Provincial & Local Impact Models • Provincial Human Resources Module • International regional comparisons
PTSA: Conclusions: CONCLUSIONS • PTSA is technically feasible • Foundation for further developments • Potential to develop comparable cross- border accounts • Main challenges: data quality & consistency, communications and politics-- meeting information needs vs biggest number syndrome
THANK YOU FOR YOUR ATTENTION! WEB: www.smmra.com E-Mail: smeis@rogers.com