Download
1 / 26
260 likes | 323 Views
California Climate Observations: CalSat. Randy Friedl, Jet Propulsion Lab Steve Hipskind, Ames Research Center. Outline. • California Climate Assessments / Issues • Observation needs • Observation capabilities • Observation strategy Aircraft, including UAS - (e.g., Global Hawk)

E N D
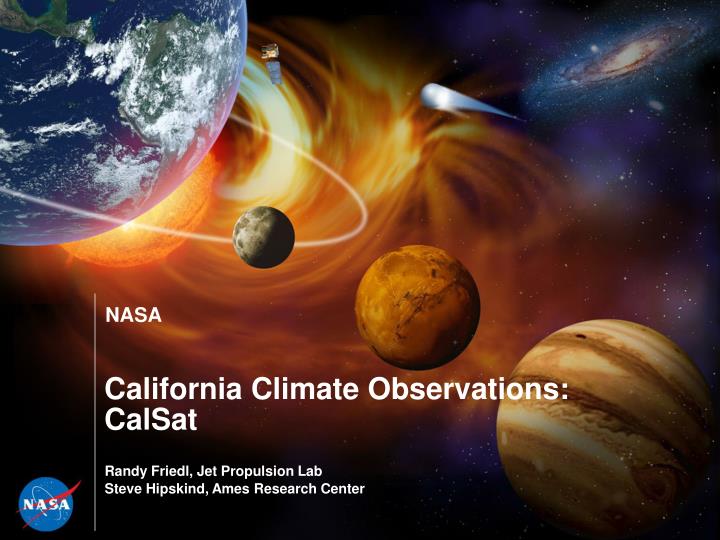
California Climate Observations:CalSat Randy Friedl, Jet Propulsion Lab Steve Hipskind, Ames Research Center
Outline • • California Climate Assessments / Issues • • Observation needs • • Observation capabilities • • Observation strategy • Aircraft, including UAS - (e.g., Global Hawk) • LEO (e.g., QuikSCAT) • LEO constellation (NASA EOS, GPS, DMC, RapidEye) • GEO (NOAA GOES) • L1 (DSCOVR) • • ROM Costs • • Recommendations
Our Changing Climate (Assessment Priorities) • Public Health • Air Quality • Heat • Agriculture • Temperature increases • Pests / pathogens • Stresses • Rising Sea Level • Coastal Flooding / Levees • Shrinking beaches • Water Resources • Sierra Snowpack • Water supply • Hydropower • Winter Recreation • Forests & Landscapes • Wildfires • Invasive species • Shifting vegetation • Declining forest productivity • Carbon Sources and Sinks
Science Challenges Require High Spatial and Temporal Measurements and Models GCM grid ~ 150-250 km RCM grid ~ 10-50 km Aircraft & Satellite resolution ~ 0.1 – 100 km Source: R. Rood, U. Mich.
The U.S. has a highly capable observing system for global scale climate change • NASA and NOAA have 29 spacecraft and over 120 instruments currently observing the Earth system • NRC notes that this capability will decrease dramatically over next ten years, even if U.S. implements NRC Decadal Survey recommendations NASA’s Earth Science Satellites
Observation Capabilities • PASSIVE • Land / Ocean Surface Imaging • Multi-spectral (LANDSAT) • Hyperspectral • Atmospheric Sounding • UV/Visible Spectrometry • Near IR Spectrometry • ACTIVE • Radar • Lidar
Observation Strategy • Airborne • Conventional Aircraft • Unmanned Aerial Systems (UAS) • Airships • Balloons • Space based • Low Earth Orbit (LEO) • Single spacecraft • LEO Constellation • Medium Earth Orbit (MEO) • Geostationary Orbit (GEO) • Langrange Point (L1)
California: ER-2 Coverage from Two Missions Aircraft Enable Flexible Observation Strategy • Significant trade-offs between spatial and temporal coverage for given number of flight hours Red: Flight 03-951 8 August 2003 Blue: Flight 03-952 11 August 2003 (7 Flight hours each) Flight Line Spacing: 12nm / 23km 5 flights needed to fully cover state Total Flight Time: 35 hours MASTER RC-10
Low Earth Orbit (LEO) Trades Temporal for Spatial Coverage 600km Swath 1km Resolution 561km Altitude, Sunsynchronous • At least once-daily coverage of all of California (twice daily for some parts of northern California) • Daily coverage of US pacific cost, and California Baja • Daily coverage of nearly the entire US east cost • Sparse global coverage including: • UK, France, Spain, Japan, China, Russia • Complete Daily coverage of polar regions between 70° and 84° Latitude • Non-sun synchronous orbits open up more coverage possibilities
The NASA LEO Orbiting Carbon Observatory (OCO) Mission will travel over California 6 times every 16 days • The green lines represent OCO flight paths over California and neighboring land and ocean regions • These flight paths are repeated every 16 days • ~2 weeks between exact revisits • 5 days between nearest neighbor paths • OCO makes more than 20,000 measurements over California every month • Clouds and aerosols will prevent many measurements from sampling all the way to the surface • Measurements from flight paths over the land and ocean regions surrounding California can establish the net flow of CO2 emissions in and out of the state • In its standard survey mode, OCO will be able to detect XCO2 variations as small a 1 ppm out of 380 ppm (0.3%) in a single sounding over bright surfaces • This corresponds to CO2 sources produced by burning as little as 7500 gallons of gasoline or diesel (<2 tanker trucks) • OCO should easily detect heavy traffic patterns over major urban areas 1 2 3 4 5 6
Medium Earth Orbit (MEO) provides Spatial – Temporal Compromise • MEO altitudes are between ~1500 – 35000 km • Combining MEO orbit with wide swath (~1000 km) instrument can provide up to 6 passes over California per day
Molniya Orbit Provides Longer Regional View A highly elliptic orbit with 63.4° inclination and ~12 hour orbital period. Satellite spends ~ half day over a designated area of the earth. Orbital altitude is near 40,000 km.
Geosynchronous Orbit (GEO) Provides Constant View of Full Disk • GEO altitude is ~35,000 km • Full Disk GOES Image (+/- 65°) • Provides ability to stare at given region; provides high temporal resolution • Ideal for tracking fast moving events such as forest fires
California: ER-2 Coverage from Two Missions Langrange point (L1) provides full, daytime view of Earth • L1 Orbit is ~1.5 million km from Earth; undergoes 4-15 degree Lissajous orbit • DSCOVR was planned to provide first Earth observations from L1 (e.g. O3, aerosols, water) • Federal/Industrial partnership being studied for DSCOVR
Comparison of Earth Views from GEO and L1 • Optics at GEO. The blue circle represents a 1 degree half angle that covers California and the green circle represents a 4 degree half angle to cover the continental US. • Optics at L1. The red circle represents a 0.1 degree half angle to cover California.
Rough Order of Magnitude (ROM) Costs* • Airborne • Conventional Aircraft ($10M/Year) $50M 1 • Space based • Low Earth Orbit (LEO) • Single spacecraft $50-150M 0.08 • Medium Earth Orbit (MEO) $150M 0.08 • Geostationary Orbit (GEO) or Molniya $300M 24 (Potential for co-launch on commercial spacecraft) $50M • Langrange Point (L1) $300M 12 (DISCOVR refurbishment and commercial partnership) $30M 5 Year Mission California Coverage (~4x10⁵Km2-hr/day) *Assumes creative, cost-effective implementation strategies
Maximizing Observational Assets for Regional Change Requires Clear Science Goals and Detailed System Engineering Gas and Particle Concentrations Pollutant Data Air Quality Predictions
Recommendation • A robust regional climate observing system does not currently exist and will require integration of spaceborne, aircraft and groundbased measurement approaches. • Development of a regional observing system must be done in concert with development of regional modeling capabilities that are firmly tied to global climate model input. • An in-depth analysis of regional observing requirements should be pursued, along with a more detailed analysis of observing options that would be cost effective for state. • Regional observation strategies should leverage the substantial Federal investment in global scale observations. State options could include state satellite launch, joining or initiating a consortium or buying data commercially.
California Economy Ranking • The World Fact Book (CIA) • The rankings are:[12] • 1. the combined United States • 2. China • 3. Japan • 4. India • 5. Germany • 6. United Kingdom • 7. France • 8. Italy • 9. Russia • 10. California • 11. Brazil • 12. Canada • 13. Mexico • 14. Spain • 15. South Korea • (2005 estimates) • California Legislative Analyst's Office • The rankings are:[13] • 1. the combined United States • 2. Japan • 3. Germany • 4. United Kingdom • 5. France • 6. California • 7. Italy • 8. China • 9. Canada • 10. Spain • (2004 data)
Countries w/ Earth Observing Satellites • US (Government & Commercial) • Russia • European Space Agency • UK • France • Germany • Israel • Thailand • Singapore • Taiwan China Brazil Korea Japan India Algeria Nigeria Turkey
Low Cost Earth Observing Options • Disaster Monitoring Constellation (DMC) • Multi country consortium • Moderate resolution LANDSAT type observations • Low cost satellites (<$20M) • Each country pays for their satellite, shares data with consortium • Members: UK, China, Algeria, Nigeria, Turkey • Surrey Satellite Technology, LTD build and launch satellites • RapidEye • Commercial venture • High resolution (6m), multi-spectral observations • Targeted for agricultural applications • Low cost for imagery compared to current providers ($1/km2) • Cost to cover California ~$400K (~400K km2)
Earth Observing Satellites(Commercial) • * Disaster Monitoring Constellation • * IKONOS • * QuickBird • * SPOT • * EROS • * RapidEye • * FORMOSAT-2
Earth Observing Satellites(NASA EOS) • FLAGSHIP MISSIONS • * Terra (EOS AM-1) • * Aqua (EOS PM-1) • * Aura • * TRMM • * Jason 1 • EARTH SYSTEM SCIENCE PATHFINDER (ESSP - PI led missions) • * GRACE • * IceSAT • * Cloudsat/CALIPSO • * OCO • * Aquarius