Understanding Periodic Functions and Climate Change Impact on CO2 Levels
This homework assignment focuses on periodic functions and their application in understanding climate change, specifically carbon dioxide levels over time. Students are required to analyze functions such as sin(x) and calculate properties including period and amplitude. The task involves interpreting data, making predictions based on periodicity, and understanding the implications for climate change. Resources include videos and additional learning materials that facilitate a deeper comprehension of quantitative environmental metrics.

Understanding Periodic Functions and Climate Change Impact on CO2 Levels
E N D
Presentation Transcript
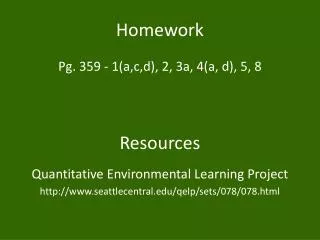
Homework Pg. 359 - 1(a,c,d), 2, 3a, 4(a, d), 5, 8 Resources Quantitative Environmental Learning Project http://www.seattlecentral.edu/qelp/sets/078/078.html
Focus time • No talking • No eye contact
CO2 and Climate Change Periodic Functions Unit (Chp.5)
Periodic Function A pattern of y-values that repeats at regular intervals
Is this function periodic? NO! The y-values change over time
Period The time it takes to complete a pattern
? What’s the period of this function? The period of this function is 2π
Amplitude (A) From the middle of the graph to the peak
A Method 1 Count from middle to peak A = 3 ppm
max to min Method 2 Find max to min, then divide by 2 Max-to-min = 6 A = 6/2 = 3
max to min What is the amplitude?
3 0.5 What is the amplitude?
What is the amplitude? A = 1.75
If f(1964) = 322.00 and the period of the function is 1 year, what is f(1965) = ?
If f(1964) = 322.00 and the period of the function is 1 year, what is f(1965) = ? Since the pattern repeats exactly 1 year later, the level of carbon dioxide will be the same
If f(3) = 3 and f(6) = 2 and the period for the function is 8 what is f(11) = ?
Period = 8 If f(3) = 3 and f(6) = 2 and the period for the function is 8 what is f(11) = ?
Pg. 361 #6 Distance (m) 50 40 30 20 10 1 2 3 4 5 6 7 Time (min)
Pg. 361 #6 Distance (m) 50 40 30 20 10 1 2 3 4 5 6 7 Time (min)
Pg. 361 #6 Distance (m) 50 40 30 20 10 1 2 3 4 5 6 7 Time (min)
www.nss-gr11.wikispaces.com • Videos • Links • Powerpoint from class