Modelling Ancient Earth Climate: Methods & Models
Modelling Ancient Earth Climate: Methods & Models. Prof. Alan M. Haywood School of Earth & Environment, University of Leeds, Leeds, LS2 9JT . with contributions from Paul Valdes, Ulrich Salzmann, Victoria Peck, Steve Hunter & Jane Francis. Why?. Understand the dynamics of warm climates

Modelling Ancient Earth Climate: Methods & Models
E N D
Presentation Transcript
Modelling Ancient Earth Climate: Methods & Models Prof. Alan M. Haywood School of Earth & Environment, University of Leeds, Leeds, LS29JT. with contributions from Paul Valdes, Ulrich Salzmann, Victoria Peck, Steve Hunter & Jane Francis
Why? • Understand the dynamics of warm climates • Test Earth System Models
Primary Research Focus in Climate Change Science • Simulation of the historical or near-historical record • Analysis of the observed record of variability • Projection for the next 100 years Greatest Strengths Spatial and temporal character of the Observations. Measurement of physical quantities that define the state of the atmosphere and ocean. Greatest Weaknesses Sense of change. Sense of the integration of the Earth System.
In contrast: A Research Focus in Earth History Greatest Strengths Spectacular sense of change (Furry Alligator Syndrome) True integrated system response Greatest Weaknesses Proxies rather than state variables Limited spatial and temporal resolution “The greatest weaknesses in a research focus on the modern record are the greatest strengths of Earth System History”
IPCC Climate Sensitivity: Roughly 1.5 to 4.5 C globally averaged surface temperature increase for a doubling of carbon dioxide. Hundreds of GCM experiments have been completed for time periods throughout the Phanerozic using a wide variety of climate models. Many experiments focused on either glacial climates or warm climates (the extremes). We Should Worry “There is no legitimate example of a climate model simulation in which the past climate conditions were overestimated”
Climate History
Atmospheric carbon dioxide through the Phanerozoic and projected into the next century. Inset modified from figure constructed by S. Porter (2003). L. Sohl constructed the Phanerozoic portion (2003).
General Circulation Models Model needs to simulate albedo, emissivity and general circulation. Use “first principles” Newton's Laws of Motion 1st Law of Thermodynamics Conservation of Mass and Moisture Hydrostatic Balance Ideal Gas Law
Spectrum of Climate Models ESM EMIC Complexity Coupled Ocean Atmosphere GCM (OAGCM) AGCM + Slab Ocean Model Atmospheric General Circulation Models (AGCM) Energy Balance Models (EBM’s) Number
Aerosols: Dust and Sulphates Regional Model: High Resolution Cryosphere-Lithosphere Model Atmospheric General Circulation Model Atmospheric Chemistry Land Surface Hydrology Ocean Carbon Cycle Ocean General Circulation Model Terrestrial Carbon Cycle Components of an Earth System Model
Development of Met. Office Climate Models ATMOSPHERE OCEAN ICE SULPHUR CARBON CHEMISTRY LAND Present ATMOSPHERE OCEAN ICE SULPHUR 1999 CARBON LAND 1997 ATMOSPHERE OCEAN ICE SULPHUR LAND 1992 ATMOSPHERE OCEAN ICE LAND Component models are constructed off-line and coupled in to the climate model when sufficiently developed ATMOSPHERE OCEAN LAND 1990 ATMOSPHERE 1985 LAND ATMOSPHERE 1960s
Physical basis of climate models • The atmosphere is a fluid on a rotating planet: • Drag at the surface and within the atmosphere affects the momentum budget • Water vapour evaporates from the surface, condenses to form clouds and heats the atmosphere when it is lost through precipitation • Heating from solar radiation and cooling from thermal radiation • Models therefore need to include equations for; • 3 components of wind (or vorticity & divergence), including Coriolis and drag • equation of state and conservation of water • thermodynamics, including heating by condensation and radiation
Physical basis of climate models • The ocean is also a fluid, but incompressible. It is heated by solar radiation and cooled by evaporation and thermal emission from the surface. No internal heating, but salinity strongly affects the density and hence the circulation • Additional models have been developed to include the land surface, cryosphere, atmospheric chemistry and aerosols, carbon cycle etc • Processes that are sub-grid in scale are modelled by parametrizations
HadCM3 GCM Atmospheric resolution: 3.75 by 2.5 degrees 19 Atmospheric Levels Ocean resolution :1.25 by 1.25 20 Ocean Levels
30km 19 levels in atmosphere 2.5 lat 3.75 long THE HADLEYCENTRETHIRDCOUPLEDMODEL -HadCM3 no flux adjustments 1.25 1.25 20 levelsin ocean -5km
Representation of orography;the importance of resolution The upper figure shows the surface orography over North America at a resolution of 480km, as in a low resolution climate model. The lower figure shows the same field at a resolution of 60km, as in a weather forecasting model. Remember that orographic processes are highly non-linear.
So……… The horizontal and vertical resolutions of climate models need to be high enough to avoid numerical errors and to resolve the basic dynamical and transport processesThere is a trade-off between resolution and computing time, but model resolutions are increasing continually, as more computer power becomes available
Temperature Change Ice Sheet Elevation From Peltier, 1994 Precipitation Biomes
Case Studies 1. Palaeo ENSO (El Niño Southern Oscillation) • Coupled ocean-atmosphere • phenomena • Involves large scale fluctuations • in a number of oceanic/atmospheric variables (e.g. sea surface temps. • & sea level pressure) • El Niño & La Niña opposite extremes • of ENSO
Strong Gradient No Gradient The Pliocene: a Permanent El Niño-like state? (Wara et al., 2005; Philander & Federov, 2003) Mg/Ca SSTs 0 3 5 Age (Ma)
Can a model reproduce this change? PlioControl ocean temperatures (C) across the Pacific at 0N Difference between PlioceneControl and Pre-Ind (C) 0 400 1000 3000 5000
ENSO rather than permanent El-Niño! Haywood et al. (in-press). Paleoceanography
“In search of palaeo-ENSO: significance of changes in the mean state” 1 sample per 10,000 years
Additional Modelling Experiments • Ocean Gateways • Trace Gas Concentrations • Altered Model Parameters
Case Studies 2. Ice-Sheet Initiation (E/O boundary) Marine 180 Antarctic ice-rafted detritus E/O boundary Palaeobotanical Evidence Zachos et al. (2001)
Palaeocene Present Antarctica: from Greenhouse to Ice-house
Causal Mechanisms for Antarctic Ice-Sheet Initiation • Ocean Gateways • Antarctic elevation • Declining atmospheric CO2 concentrations
Important Gateways Evolution of major ocean gateways since the Eocene. During the last 50 million years (Ma) subtropical gateways (blue bars) closed and high latitude gateways (red bars) opened. (Figure courtesy of Bill Hay, GEOMAR).
GCM - Climatologies DeConto & Pollard, 2003.
Ice-sheet Model DeConto & Pollard, 2003.
Ice-sheet Model 3 X CO2 2 X CO2 DeConto & Pollard, 2003.
Sensitivity Tests DeConto & Pollard, 2003.
Initial Modelling
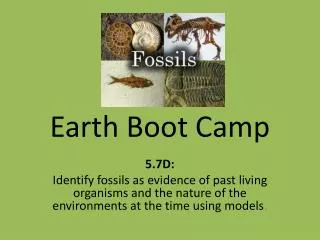
Case Studies 3. Cretaceous Climates & Ice-Sheets Palaeobotanical Evidence Cretaceous forest 120 million years ago on the Antarctic Peninsula. reconstruction based on PhD of Jodie Howe, University of Leeds/BAS, painted by Robert Nichols.
Evidence for large, rapid sea-level changes (Miller et al., 2005) • Evidence for eustatic nature • Pace and magnitude suggest glacial origin. • Suggest moderate-sized ice sheets (5 - 10 × 106 km3 ). • Paced by Milankovitch forcing. • CO2 levels through the Maastrichtian • 2 greenhouse episodes 1000-1400 ppm • But suggestions of CO2 low-points at ~70 and 66 Ma. • (Nordt et al., 2003; Beerling et al., 2002).
How to create a Maastrictian model Change solar output ~0.6% less than present CO2 (and other gases) 4 x pre-industrial (but could be 2x to 8x. Volcanic activity Assume same as today. Change in orbit Same as present, but perform sensitivity simulations Palaeogeography Including sea-level/ orography/ bathymetry/land ice Previous modelling also required prescription of vegetation, and sea surface temperatures (or ocean heat transport) but this is no longer needed.
Maastrictian Orography At climate model resolution. Original palaeogeographies from Paul Markwick
Coupled Ocean-Atmosphere Simulation:Comparison to Oxygen Isotopes Model predicted temperatures approx. 10C at 1000m, 8C at 2000m, and 7C at 3000m c.f. temperatures from 14C to 7C from D’Hondt & Arthur (2002) Paul Pearson's Maastrictian data
Coupled Ocean-Atmosphere Simulation:Comparison to Vertebrate Data Red squares= all crocs, Orange= Dinosaurs, White = Other Vertebrates Model predicted cold month mean shown by 5C contour(red)and 0C(blue) Paul Markwick's database
2xCO2 - ~ 2 x 10⁶ km3 ice Ice Sheets in a Greenhouse World • Suite of HadCM3 derived palaeoclimates • 2, 4, and 6 x CO2 • Further runs being carried out including 1 x CO2 • Comparison against climate proxy database • Climate then used to drive a BAS ice-sheet model. 2xCO2 4xCO2 + favourable orbit
The Future: Data & Models Combine • Limiting Factors: • Available computer power • Model sophistication (resolution etc.) • Small community (“every department needs a pet modeller”) • Language barriers & a lack of communication • A new generation of scientists to act as the interface • A couple of examples what modellers need from the geological community • Ocean temperatures • Land cover “Deep-time perspectives on climate change: marrying the signal from computer models and biological proxies (Eds. M. Williams, A. M. Haywood, J. Gregory and D. Schmidt) The Micropalaeontological Society & the Geological Society of London”
Oceans: Quantitative temperature estimates derived from multi-proxy studies PRISM & MARGO Kucera et al. (2005) QSR Vol. 24, 813-819 H. Dowsett (in-press).
New 3-D Ocean Temperature Reconstructions: multiple equilibrium?
Land Cover: Vegetation and Biomes derived from paleobotanical studies Proxies Data Biomes Pollen Rainforest Translation and Reconstruction Fossil Leaves Grassland • Nearest Living Relatives • Plant functional types • Full Biomisation Savanna Fossil Wood